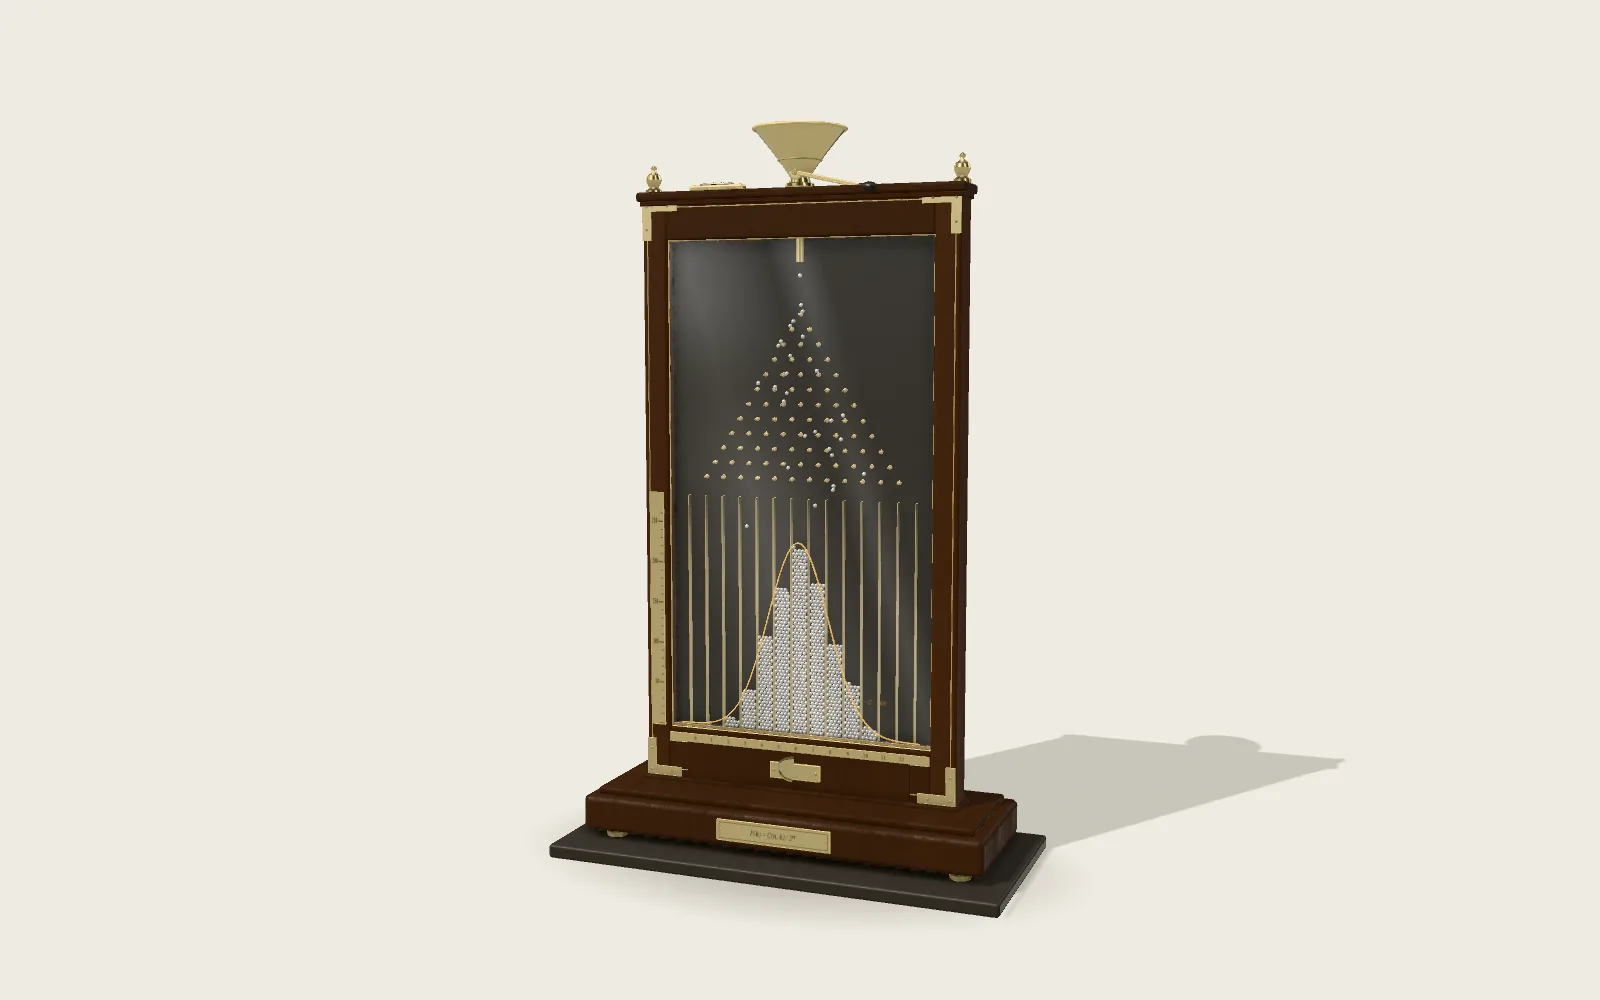
Determined, Yet Unpredictable
Three variables, three equations, nothing random anywhere. From the same start it traces the same path every time; move the start by a millionth and the two paths run together, then pull apart, then have nothing in common. That is chaos.
Scroll
Convection in Three Numbers
A layer of fluid is heated from below and cooled from above. Warm fluid rises, cool fluid sinks, and the layer rolls over in convection cells. The three equations published in 1963 are a minimal model of this.
x is the strength of the convection, its sign the way the rolls turn; y is the temperature difference between the rising and the sinking fluid; z is how far the vertical temperature profile bends away from a straight line. σ = 10 is the fluid’s Prandtl number, ρ is the heating relative to the heating at which convection just begins, and β = 8/3 comes from the shape of the rolls.
The brass wire of the sculpture is the path (x, y, z) takes at ρ = 28. Its two wings are the two ways the rolls can turn. The red thread is the stretch being drawn now.
A Leaking Waterwheel
A tilted wheel carries a ring of cups, each with a small hole in its floor. Water pours in at the highest point; the cups fill and leak at once.
A full cup at the top pulls that side down. If the wheel turns fast, cups pass the top before they fill; if it turns slowly, one side grows heavy, is carried over the top, and the wheel slows, stops and turns back. The reversals come at no regular time.
Write the wheel’s angular velocity and two components of the water’s spread round the rim as x, y and z, and the wheel’s three equations are the Lorenz equations, with β = 1. More inflow means a larger ρ. This wheel runs on its own equations in real time, at ρ = 28.
Three Decimals Short
In the early 1960s Lorenz ran a twelve-variable weather model on an LGP-30 computer. To look at a stretch again, he typed back a line of numbers it had printed earlier and restarted it from there.
About an hour later the machine had worked out some two months of weather. The new run matched the old at first; then the differences roughly doubled every four days, and by the second month all resemblance was gone. The machine carried about six decimals, but the printout showed three: he had typed in rounded numbers.
Later retellings use 0.506127 and 0.506 as the example. The figure does the same with the three variables here: one state, written to six decimals and to three, run twice.
A Millionth Apart
Move the start by 10⁻⁶ along x and run again. The two lines start as one; on average their distance grows about e^0.9 ≈ 2.5 times per unit of time, ten times every 2.5 units.
On a log scale that growth is a straight line, and its slope is the largest Lyapunov exponent, about 0.906. By t ≈ 18, on average, the distance is as large as the attractor, and from then on the two go their own ways.
So measuring better buys little: an initial error ten times smaller gains only about 2.5 units of time.
Never Repeating, Never Crossing
The path never stops at a point and never returns to a state it has passed to start a loop: it does not repeat. The equations fix one velocity at every point, so in three dimensions two stretches of path never cross; a crossing would have two ways on.
Nor does it wander off. Every path is drawn onto the same bounded shape, the attractor. The centres of its wings are two fixed points, C± = (±√(β(ρ−1)), ±√(β(ρ−1)), ρ−1), here (±8.49, ±8.49, 27). The path circles one, then at no regular time jumps to the other.
The shape has a fractal dimension of about 2.06: a little more than a surface, countless sheets lying close together.
How Hard It Is Heated
Below ρ = 1 the heating is too weak, the fluid stays still, and every path returns to the origin. Between 1 and about 13.93 the convection is steady, and paths settle straight into C+ or C−.
Between about 13.93 and 24.06 paths wander chaotically for a while and still end in C±: transient chaos, longer the closer ρ is to 24.06. Between 24.06 and 24.74 the chaotic attractor and the stable C± exist side by side, and the start decides which one a path finds. Above 24.74, C± are unstable and only the chaos is left.
The sculpture shows ρ = 0.6, 10, 20 and 28 in turn. The brass wire stays the shape for ρ = 28.
Two Weeks
On 29 December 1972, at the 139th meeting of the American Association for the Advancement of Science, Lorenz gave a talk titled “Predictability: Does the Flap of a Butterfly’s Wings in Brazil Set Off a Tornado in Texas?”. The phrase “butterfly effect” spread from there.
The atmosphere is far more than three variables, but just as sensitive. Research estimates that even with a near-perfect model and starting state, midlatitude weather can be forecast at most about two weeks ahead: useful forecasts reach about 10 days today, and an initial error ten times smaller would add at most about 5 days.
That is why forecasts start from a set of slightly different states, run them all; how fast they spread says how far the forecast can be trusted.
The Bench
ρ from 0 to 35 sets both the two threads on the sculpture and the wheel’s inflow (the wheel is the case β = 1). “Nudge by 10⁻⁶” sends a new blue thread from where the red one is now. The readouts are the distance between the threads, the wheel’s angular velocity and its number of reversals.
Try thisSet ρ to 20: the two threads wander at first. Where do they end up?
What the model leaves out
The brass wire is 24 units of time of the path from (1, 1, 1), after dropping the first 6, bent to its true coordinates at about 1.6 cm per unit; in projection it seems to cross itself, in three dimensions it does not. The threads are computed with fourth-order Runge–Kutta at a step of 0.005, at 0.8 units of time per second. The wheel runs on its own three equations in real time, with a leak rate K = 0.3/s; the water in the cups shows only the first two harmonics of its spread. A real wheel has a finite number of cups and water arriving in gulps, and the equations are an approximation to it. The wheel is the Lorenz system with β = 1, not the sculpture’s 8/3, so it turns chaotic above ρ ≈ 17.5.
Easy to misread
Chaos is not randomness: nothing in the equations rolls dice, the same start always gives the same result, and the first dozen or so units of time are perfectly predictable; it is the long run that cannot be foreseen. Nor does the “butterfly effect” say that small causes must have large effects; it says that tiny differences in the starting state make the long-run outcome entirely different, with no way to tell which difference. And these three equations are a drastic simplification of convection; a real fluid heated this hard does not move like this. Their point is that very simple deterministic equations can produce motion that never repeats.
Sources
- Edward N. Lorenz (1963), Deterministic Nonperiodic Flow, Journal of the Atmospheric Sciences 20(2): 130–141
- Barry Saltzman (1962), Finite Amplitude Free Convection as an Initial Value Problem—I, Journal of the Atmospheric Sciences 19(4): 329–341
- Edward N. Lorenz (1993), The Essence of Chaos, University of Washington Press (the restart, pp. 134–135; the butterfly title, p. 14)
- Edward N. Lorenz (1991), A Scientist by Choice, Kyoto Prize lecture (about six decimals carried, three printed; unrecognisable after two months)
- Edward N. Lorenz (1972), Predictability: Does the Flap of a Butterfly’s Wings in Brazil Set Off a Tornado in Texas?, 139th meeting of the AAAS, Washington
- Steven H. Strogatz, Nonlinear Dynamics and Chaos, chapter 9 (the waterwheel, §9.1 and exercise 9.1.3: β = 1; the bifurcations in ρ, §9.5)
- J. C. Sprott, Lyapunov exponent spectrum of the Lorenz system (0.9056, 0, −14.572)
- P. Grassberger, I. Procaccia (1983), Measuring the strangeness of strange attractors, Physica D 9: 189–208 (dimension about 2.05–2.06)
- F. Zhang et al. (2019), What Is the Predictability Limit of Midlatitude Weather?, Journal of the Atmospheric Sciences 76(4): 1077–1091
Data
Edward N. Lorenz published the three equations in 1963, in “Deterministic Nonperiodic Flow” (Journal of the Atmospheric Sciences 20: 130–141), as a simplification of a convection model by Barry Saltzman (1962). The rounded restart follows Lorenz’s own account in The Essence of Chaos (1993) and his 1991 Kyoto Prize lecture. The numbers 0.506127 and 0.506 come from James Gleick’s retelling in Chaos (1987), not from Lorenz. The title of the 1972 talk was supplied by the session’s convener, Philip Merilees; Lorenz had used a sea gull before. The chaotic waterwheel was devised at MIT in the 1970s by Willem Malkus and Louis Howard; its equations and their map to the Lorenz system (β = 1) follow Steven Strogatz, Nonlinear Dynamics and Chaos, §9.1. The two-week limit is from Zhang, Sun, Magnusson, Buizza, Lin, Chen and Emanuel (2019). The waterwheel and the brass sculpture are our own models.
Watch next
The player comes from YouTube and loads only when you press play.
Follow the question
 Plate M06Half a Turn Is e to the iπeⁱᵗ is a point walking round the unit circle at a steady pace, its velocity always i times its position. After time π it is at −1.
 Plate M03Any Closed Line, Drawn by Turning CirclesA chain of arrows, head to tail, each turning at a whole-number speed: the last tip can draw any closed line.