Measuring Dark Energy
DESI’s 5,020 robots point optical fibres at galaxies. Where the galaxies lie hides a ruler about 480 million light-years long, which measures how the universe expands.
Chapters · 15
- 01The Expansion History
- 02A Ruler Frozen into the Galaxies
- 03Redshift in a Spectrum
- 04At the Top of the Telescope
- 05Six Lenses
- 06Ten Petals
- 07One Robot, Two Arms
- 08A New Field in Two Minutes
- 09Nearly Fifty Metres of Fibre
- 10Ten Spectrographs, Thirty Cameras
- 11A 3D Map
- 12Is Dark Energy Changing?
- 13What Would Settle It
- 14Taken Apart
- 15The Laboratory
Scroll
The Expansion History
The universe is expanding. About a quarter of a century ago, distant supernovae showed that the expansion is speeding up; whatever speeds it up is called dark energy. The simplest explanation is a “cosmological constant”: energy whose density does not change with time. If dark energy changes, the expansion rate in each era differs from what a constant predicts.
DESI measures distances: at different redshifts, that is, at different times in the past, how far away galaxies are and how fast the universe was expanding then, reaching back about 11 billion years. In three years of data (DR2), each redshift bin’s distance is measured to between 0.45 % and 1.54 %.
seven redshift bins · 0.45–1.54 % per bin (DR2) · about 11 billion years back
A Ruler Frozen into the Galaxies
The early universe was a hot plasma carrying sound waves. By a redshift of about 1060 the photons stopped dragging ordinary matter along, the waves stalled, and they left one fixed distance: about 147 megaparsecs (Mpc), about 480 million light-years. These are baryon acoustic oscillations, BAO for short.
The distance is printed in how galaxies are spread: pairs of galaxies about 147 Mpc apart are a little more common than pairs at other separations. It is a statistical effect. A single galaxy has no visible ring round it; the red ring on the plaque only marks the ruler’s length. In 2005 the Sloan Digital Sky Survey measured it with 46,748 galaxies, and the 2dF survey reported it the same year. Since the ruler’s length is known, how large it looks at each redshift gives the distance.
about 147 Mpc ≈ 480 million light-years · measured in 2005 (SDSS, 46,748 galaxies, 3.4σ)
Redshift in a Spectrum
A galaxy’s redshift comes from its spectrum. The longer light travels, the more the expansion of the universe stretches it, and the further its spectral lines move towards the red. The redshift z is (observed wavelength − original wavelength) ÷ original wavelength.
Each fibre carries one galaxy’s light to a spectrograph, which measures how far its lines have moved. Galaxies forming stars give off a pair of oxygen-ion lines near 372.7 nm; in a galaxy at redshift 1 they appear at about 745 nm, and DESI can find them out to redshift 1.6.
z = (λ observed − λ original) ÷ λ original · [O II] 372.7 nm → about 745 nm at z = 1
At the Top of the Telescope
DESI is mounted on the Mayall telescope on Kitt Peak, Arizona. Its 4-metre primary mirror reflects the light up to the prime focus at the top of the tube; DESI’s first lens is about 8.7 m above the mirror, and from it to the focal surface runs a 2.43 m train of lenses. With the new cage and vanes, the top end’s mass budget is 10,700 kg.
Here the top end is taken off and laid on its side at 1:4: six lenses in a steel barrel, the focal plane and its enclosure behind them, and the hexapod that hangs the barrel from the cage’s middle ring. A piece is cut away at the front and top, the cut faces painted red. A 1.75 m person stands beside it.
4 m primary · first lens about 8.7 m above it · 2.43 m from C1 to the focal surface
Six Lenses
The six lenses take the light from the primary and bring a field 3.2° across (about 8 deg², about 40 full Moons) to a sharp focus, changing the focal ratio from f/2.8 to about f/3.9. The largest, C1, is 1.14 m across and weighs 201 kg; C4 is 1.03 m and 237 kg; the six weigh 864 kg in all.
The middle two are the atmospheric dispersion corrector: two borosilicate lenses ground with a wedge of about 0.25°, each in a large bull gear, turning in opposite directions. When the telescope looks low in the sky, the air acts as a weak prism and draws each star into a tiny rainbow streak; turned to the right angles, the two wedges pull it back.
C1 1.14 m · C4 1.03 m · a 3.2° field, about 8 deg² · 864 kg of glass
Ten Petals
The focal surface is 812 mm across, slightly convex, and divided into ten 36° wedges called petals. Each petal is an 8.6 kg block of aluminium with 514 holes, each pointed along the chief ray at its spot: 502 hold robots, 12 hold fiducials that glow blue. The ten hold 5,020 robots.
Each petal’s 500 fibres run to one spectrograph; 2 more go to a sky-monitor camera. A guide or focus camera sits at each petal’s outer corner: six guide, four sense the wavefront. The whole focal plane is closed in an enclosure held at 11 °C.
10 × 502 = 5,020 robots · 5,000 fibres to the spectrographs · an 812 mm focal plane
One Robot, Two Arms
Each robot is a thin rod about 29 cm long and 8.3 mm across, screwed into its hole in the petal like a spark plug. At the front are two axes: the central θ axis turns the whole head, and the φ axis, about 3 mm off centre, turns an arm about 3 mm long that holds the fibre at its end. The fibre can reach any point in a circle 12 mm across.
Each axis has its own motor, 4 mm across, geared down about 337 times. Neighbours stand as close as 10.4 mm, so the circles they can reach overlap: each robot pulls its arm in, turns, then reaches out again, to keep clear of the others. The fibre’s core is 107 µm across, about 1.5 arcseconds on the sky.
arms of about 3 mm each · a 12 mm patrol circle · 10.4 mm apart at the closest · 107 µm ≈ 1.5″
A New Field in Two Minutes
An exposure usually lasts 1,000 seconds. When it ends, the telescope turns to the next field and all 5,020 robots move their fibres to new galaxies. The robots are actually moving for only 8 to 12 seconds; with the anti-collision planning, the commands and the checks, the gap between exposures is about 2 minutes, 118 s at best.
The check: the fibres are lit from the spectrograph end, so their tips shine as small points; the fibre-view camera behind the primary mirror, about 12 m from the focal surface, photographs them, works out the errors, and the robots correct once. After the correction they are off by about 6 to 9 µm, against a requirement of 10 µm.
expose about 1,000 s · move 8–12 s · about 2 min between fields · 6–9 µm off
Nearly Fifty Metres of Fibre
Each petal’s fibres gather into one cable, and each of the ten cables is 47.5 m long; with the piece of about 3 m inside each robot, the run from fibre tip to spectrograph is nearly 50 m. The cables follow the vanes to the telescope’s upper ring, down the truss, through both of the telescope’s axes and through a wall into the room that holds the spectrographs.
Each cable holds about 530 fibres, a few spares more than are used, wound round a strength member like an undersea cable. About 90 % of the light gets through. The cables break off on the floor of the model: their real length does not fit.
ten cables · 47.5 m each · about 530 fibres each · about 90 % throughput
Ten Spectrographs, Thirty Cameras
At a cable’s far end, 500 fibres line up in a slit 121 mm long, where the light enters a spectrograph. Two dichroics split it into three channels: blue 360–593 nm, red 560–772 nm and near-infrared 747–980 nm. Each has its own grating, camera and CCD; the blue CCDs are cooled to 163 K, the red and near-infrared to 140 K.
The ten spectrographs stand in two rows of five on a rack 8.5 m long, in a clean room held at 20 °C. Only one column of the rack is drawn here: two spectrographs. After each exposure, reading them out takes 60 seconds.
10 × 3 = 30 cameras · 360–980 nm · resolution about 2,000–5,500
A 3D Map
The main survey began on 14 May 2021. The first year (DR1) measured BAO with over 6 million galaxies and quasars; three years (DR2) with over 14 million, from redshift 0.1 to 2.1, plus the Lyman-α forest in the spectra of more than 820,000 quasars: a row of absorption lines that distant hydrogen gas leaves in a quasar’s light, which takes the measurement out to a redshift of about 2.3.
The planned five-year survey was finished on 15 April 2026 with more than 47 million galaxies and quasars and more than 20 million stars, above the planned 34 million. Berkeley Lab calls it the largest high-resolution 3D map of the universe so far. The plaque on the stand is this page’s sketch: a thin slice, with the Earth at its left point.
DR1: over 6 million · DR2: over 14 million · five years: over 47 million (April 2026)
Is Dark Energy Changing?
Two numbers describe dark energy here: w₀, its equation of state today, and wₐ, how fast that changes over time; a cosmological constant has w₀ = −1 and wₐ = 0. DESI’s distances are put together with the cosmic microwave background (CMB) and supernovae to find which w₀ and wₐ fit best.
Three years of data prefer a dark energy that changes, by an amount that depends on the data used: DESI alone 1.7σ, with the CMB 3.1σ, and with one of three supernova samples as well, 2.8σ, 3.8σ or 4.2σ (2.5σ to 3.9σ in the first year). The Dark Energy Survey (DES) later recalibrated its supernovae, and that combination fell from 4.2σ to 3.2σ. A discovery in physics takes 5σ; this is a hint, not yet a conclusion.
DR2: DESI 1.7σ · with the CMB 3.1σ · with supernovae 2.8–4.2σ · recalibrated 3.2σ · none at 5σ
What Would Settle It
DESI’s dark-energy results from the full five years are expected in 2027; the survey has been extended to 2028, to cover 17,000 deg² and aim for 63 million galaxies and quasars. More supernovae are coming too: DESI’s paper names ZTF and the Rubin Observatory’s survey, whose camera is the plate “The Largest Digital Camera”.
If the hint grows with more data, dark energy is not a constant, and the universe will go on expanding differently from what a constant predicts; if it fades, the cosmological constant stays the simplest explanation. For the other unseen ingredient, dark matter, see the plate “Hunting Dark Matter”.
five-year results about 2027 · extended to 2028 · 17,000 deg² · aiming for 63 million
Taken Apart
The corrector, the hexapod, the cage, the focal plane, its enclosure, the fibre cables and the spectrographs come apart one by one.
Point at a part (tap it on a phone) and it lifts on its own, with its name; the rest fade.
The Laboratory
Move w₀ and wₐ. The chart shows DESI’s seven BAO distances from three years of data and the distances this dark energy gives, both divided by the best curve for a cosmological constant; the readouts give the χ² that is left, dark energy’s density at redshift 0.5, and how wide the ruler looks on the sky at redshift 0.51.
This is this page’s model, not DESI’s analysis: it uses only the 13 numbers of DESI DR2’s Table IV and, for every w₀ and wₐ, picks the matter density and H₀r_d that fit best, in a flat universe without radiation. DESI’s conclusions also use the CMB and supernovae; with BAO alone the preference is weak.
Try thisIn the lab, set w₀ to −0.75 and wₐ to −0.86: with DESI’s BAO points alone, how much lower is χ² than for a cosmological constant? How dense was dark energy at redshift 0.5, compared with today?
What the model leaves out
The instrument is at 1:4. The lenses’ diameters, thicknesses and spacings are the as-built figures; their curves are drawn so that each lens’s full thickness matches. The ADC’s wedges are drawn at 0.25° and turned faster than real. The barrel, cage, hexapod, enclosure, focal plate adapter and stand are read off drawings and photographs, without published sizes. The focal surface is drawn as a sphere of 4.98 m radius (the real one is aspheric, about 0.2 mm off); only the robots’ heads in front of the petals are drawn, on a hexagonal grid of 502 a petal (the real edges are irregular), all parallel to the axis (each real one points along the chief ray at its spot); the 12 fiducials a petal are not drawn. The frames, boxes and conduits behind the petals are simplified from photographs. The cables break off on the floor: their real run is about 50 m, along vanes, down the truss and through two axes; eight end at the break and only two reach the two spectrographs drawn. Only one column (two spectrographs) of the 8.5 m rack is drawn. The rays are schematic, without the bending inside the lenses; the light in the fibres and the robots’ moves are sped up. The dots on the plaque are this page’s own schematic points, not DESI’s galaxies; the red ring only marks the ruler’s length. The laboratory is this page’s model.
Common misconceptions
BAO is not a visible ring round each galaxy but a small excess of galaxy pairs about 147 Mpc apart, which takes millions of galaxies to measure. “Dark energy is weakening” is not a discovery: with DESI’s BAO alone the preference is weak; combined with the CMB and supernovae it is 2.8σ to 4.2σ depending on the data, 3.2σ for one recalibrated set, and none reaches 5σ. w₀ and wₐ are a convenient description, not a physical model. Redshift measures how much the light has been stretched, not a galaxy’s colour. The robots do not “look for” galaxies; they put fibres on positions worked out in advance, and the fibre-view camera checks them. Of the 5,020 robots, 5,000 feed the spectrographs; the other 20 feed the sky monitor.
Common questions · 5
- How many fibre robots does DESI have?
Each petal is an 8.6 kg block of aluminium with 514 holes, each pointed along the chief ray at its spot: 502 hold robots, 12 hold fiducials that glow blue. The ten hold 5,020 robots.
06Ten Petals ↑- How does a DESI fibre robot move?
At the front are two axes: the central θ axis turns the whole head, and the φ axis, about 3 mm off centre, turns an arm about 3 mm long that holds the fibre at its end. The fibre can reach any point in a circle 12 mm across.
07One Robot, Two Arms ↑- What are baryon acoustic oscillations (BAO)?
By a redshift of about 1060 the photons stopped dragging ordinary matter along, the waves stalled, and they left one fixed distance: about 147 megaparsecs (Mpc), about 480 million light-years. These are baryon acoustic oscillations, BAO for short.
02A Ruler Frozen into the Galaxies ↑- How long does DESI take to move to a new field?
An exposure usually lasts 1,000 seconds. When it ends, the telescope turns to the next field and all 5,020 robots move their fibres to new galaxies.
08A New Field in Two Minutes ↑- Is DESI’s dark-energy result a discovery?
The Dark Energy Survey (DES) later recalibrated its supernovae, and that combination fell from 4.2σ to 3.2σ. A discovery in physics takes 5σ; this is a hint, not yet a conclusion.
12Is Dark Energy Changing? ↑
Sources
- DESI Collaboration (2022): Overview of the Instrumentation for the Dark Energy Spectroscopic Instrument, AJ 164, 207 (the six lenses and their sizes; a 3.2° field of about 8 deg²; 5,020 robots; 107 µm fibres, about 1.5″; 47.5 m cables; ten spectrographs in three channels; 1,000 s exposures and about 2 min between fields; the fibre-view camera)
- Silber et al. (2023): The Robotic Multiobject Focal Plane System of the Dark Energy Spectroscopic Instrument (DESI), AJ 165, 9 (ten 36° petals of 514 holes; robots ⌀8.3 mm and about 29 cm long; two arms of about 3 mm, a 12 mm patrol disc; 10.4 mm apart at the closest; 4 mm gearmotors at 337:1; 8–12 s of motion; 6–9 µm after correction)
- Miller et al. (2023): The Optical Corrector for the Dark Energy Spectroscopic Instrument, arXiv:2306.06310 (each lens’s diameter, thickness, mass and as-built spacing; 2.43 m from C1 to the focal surface; the atmospheric dispersion corrector; the 10,700 kg top end)
- DESI Collaboration (2024): DESI 2024 VI: Cosmological Constraints from the Measurements of Baryon Acoustic Oscillations, arXiv:2404.03002 (first year: over 6 million galaxies and quasars; 2.5σ–3.9σ combined with the CMB and supernovae)
- DESI Collaboration (2025): DESI DR2 Results II: Measurements of Baryon Acoustic Oscillations and Cosmological Constraints, arXiv:2503.14738 (three years: over 14 million; the BAO data of Table IV; DESI alone 1.7σ, with the CMB 3.1σ, with supernovae too 2.8σ–4.2σ; r_d defined, z_d ≈ 1060)
- DESI Collaboration (2025): Data Release 1 of the Dark Energy Spectroscopic Instrument, arXiv:2503.14745
- Eisenstein et al. (2005): Detection of the Baryon Acoustic Peak in the Large-Scale Correlation Function of SDSS Luminous Red Galaxies, ApJ 633, 560 (46,748 galaxies; 3.4σ)
- DES Collaboration (2025–2026): the DES-Dovekie supernova recalibration, arXiv:2511.07517 (3.2σ with DESI DR2 and the CMB, down from 4.2σ)
- Berkeley Lab (2024): news release on DESI’s first-year results (better than 1 % precision)
- Berkeley Lab (2025): New DESI results strengthen hints that dark energy may evolve (not yet 5 sigma)
- DESI and Berkeley Lab (April 2026): the five-year survey completed (more than 47 million galaxies and quasars; extended to 2028)
- DESI: The DESI Survey (the Lyman-α forest)
- NOIRLab: DESI Petal Installation (photograph, KPNO/NOIRLab/NSF/AURA, CC BY 4.0, used as reference)
Data
The instrument follows the DESI Collaboration’s published descriptions and drawings: the instrument overview (AJ 164, 207, 2022), the focal-plane paper (Silber et al., AJ 165, 9, 2023) and the corrector paper (Miller et al., arXiv:2306.06310), with photographs by KPNO/NOIRLab/NSF/AURA (CC BY 4.0) as reference. The lens spacings, diameters and thicknesses are the as-built prescription; the lens curvatures, the barrel’s walls, the cage, the enclosure and the spectrograph benches are read off drawings and photographs, and the notes list what is simplified. The BAO points are DESI DR2’s (arXiv:2503.14738, Table IV). The distances, the fits and the laboratory are computed by this page (src/topics/desi/science.js, tests/desi.test.js) from the formulas quoted in its sources; the laboratory is this page’s model, not DESI’s likelihood. The dots on the map plaque are this page’s own schematic points, not DESI’s catalogue. Material presets, parts and the softbox studio of the site’s model kit are ported from AirsupHQ/machine-skill (MIT, © 2026 Air Supply Technologies Inc.).
The text, pictures and models on this page are licensed CC BY-NC 4.0: free to use and adapt for teaching and other non-commercial purposes, with credit to world.lapla.si. Third-party material listed above keeps its own licence.
Cite this plate
Laplace’s Mini World, Plate F69, “Measuring Dark Energy”, https://world.lapla.si/en/desi/, CC BY-NC 4.0, updated 2026-11-05.
Follow the question
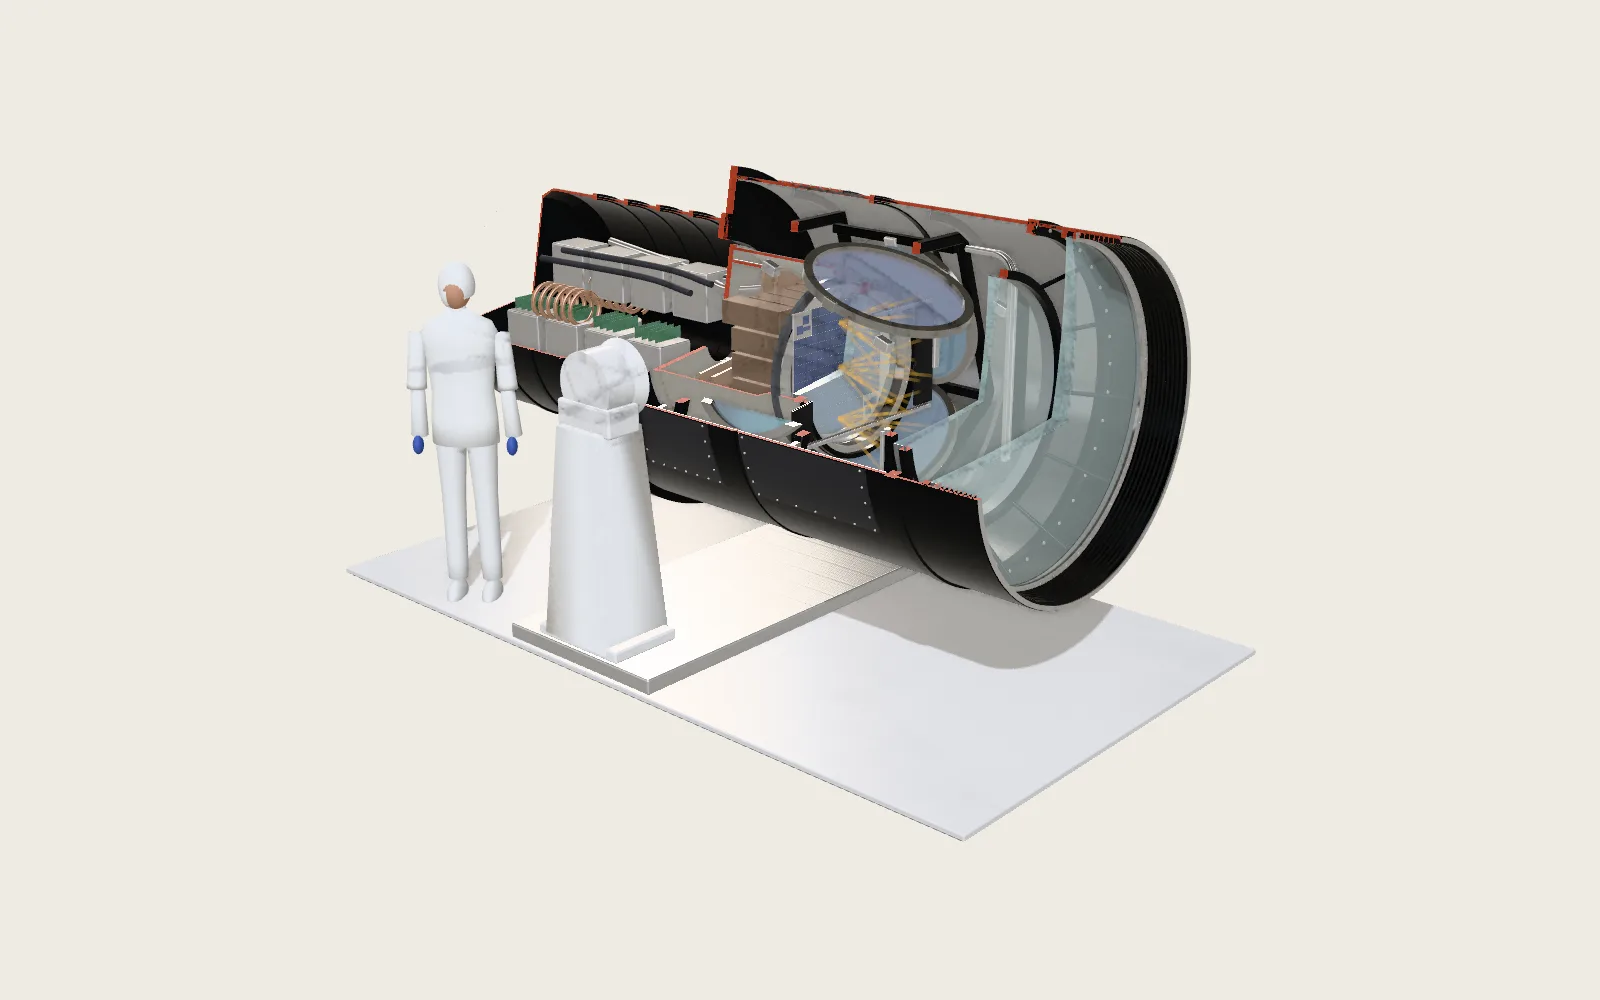 Plate F63The Largest Digital CameraThe Rubin Observatory on Cerro Pachón in Chile runs a ten-year survey with the LSST Camera: 1.65 m across, 3.73 m long and about 3 tonnes, the largest digital camera. Behind its three lenses sit 189 CCDs, 3.2 billion pixels, kept colder than −100 °C. It takes a 30-second exposure about 700 times a night, photographs every patch of the southern sky about 800 times in ten years, and sends an alert within a minute when something changes.
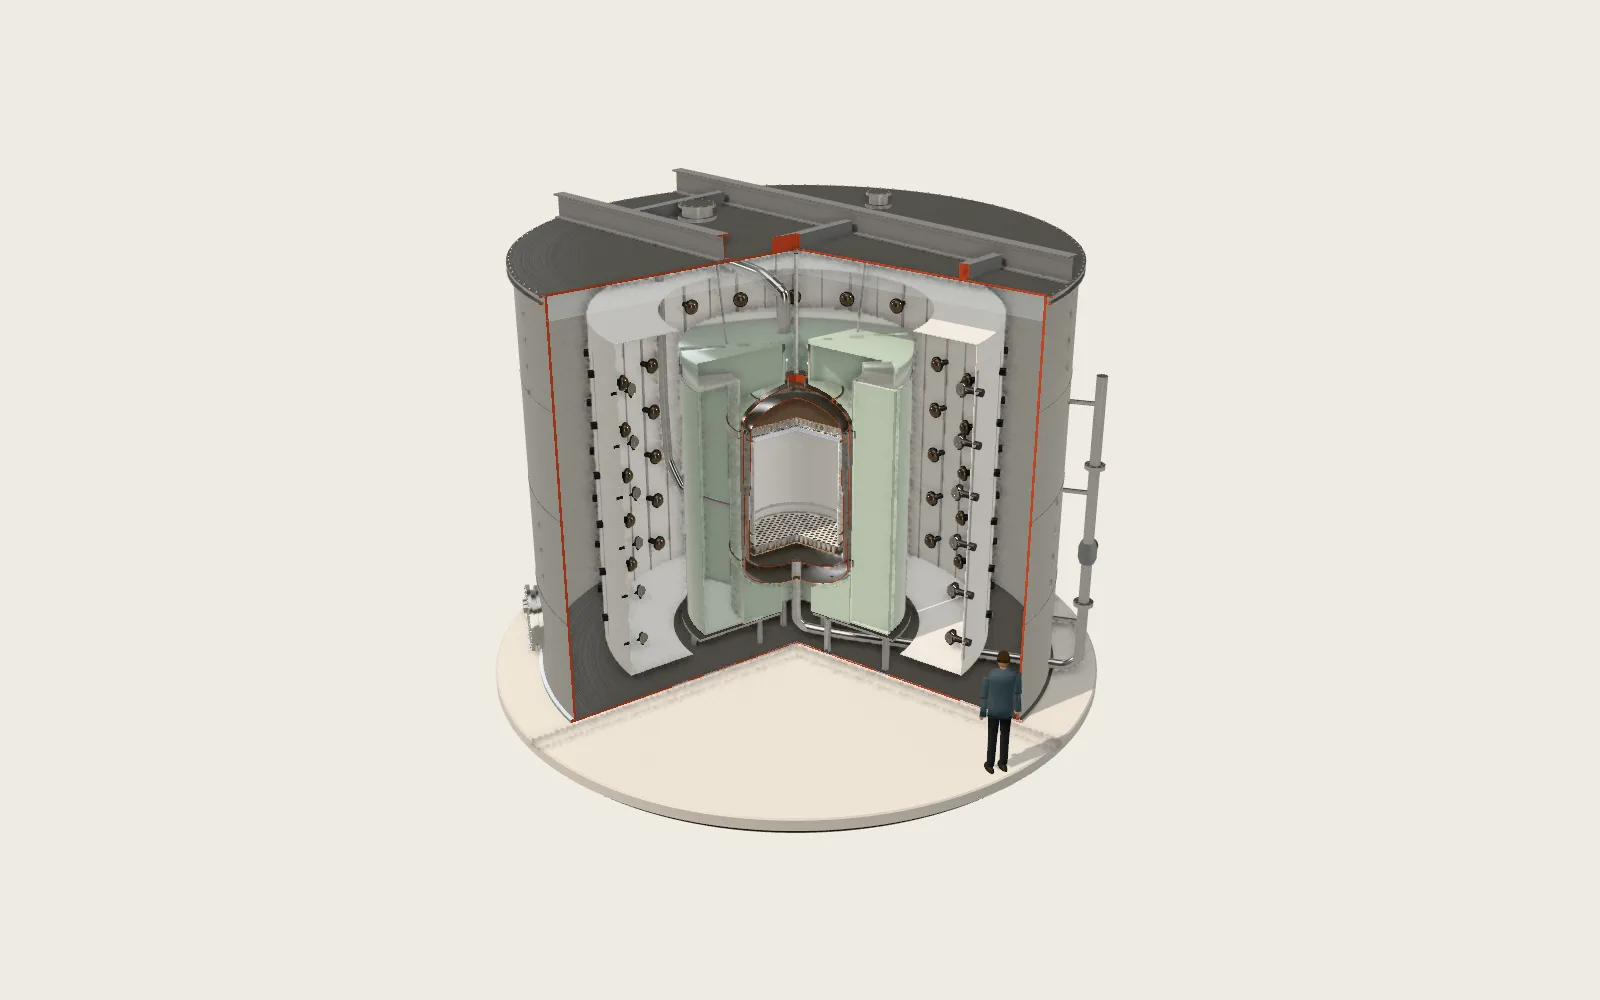 Plate F48Hunting Dark MatterA tank of liquid xenon about 1.5 km underground, waiting for a dark-matter particle to strike a xenon nucleus: the LZ detector in South Dakota.