AI Weather Forecasting
From the atmosphere now, one step to the atmosphere six hours on.
Scroll
What they can do
An AI weather model is a learned model: it reads decades of records of the atmosphere and learns to compute, from the atmosphere now, the atmosphere six hours later. In 2023 Google DeepMind’s GraphCast, tested on all of 2018, had a smaller error than the physics model HRES of the European Centre for Medium-Range Weather Forecasts (ECMWF) on 90.3 % of 1,380 scored targets. A target is one variable at one height and one lead time; 90.3 % is how many it won, not how accurate it is.
GenCast (2024) gives a whole set of forecasts at once; tested on 2019, it beat ECMWF’s ensemble on 97.2 % of 1,320 targets. On 25 February 2025 ECMWF’s own AIFS went into operation, running four times a day side by side with the physics model IFS, its forecasts open to all.
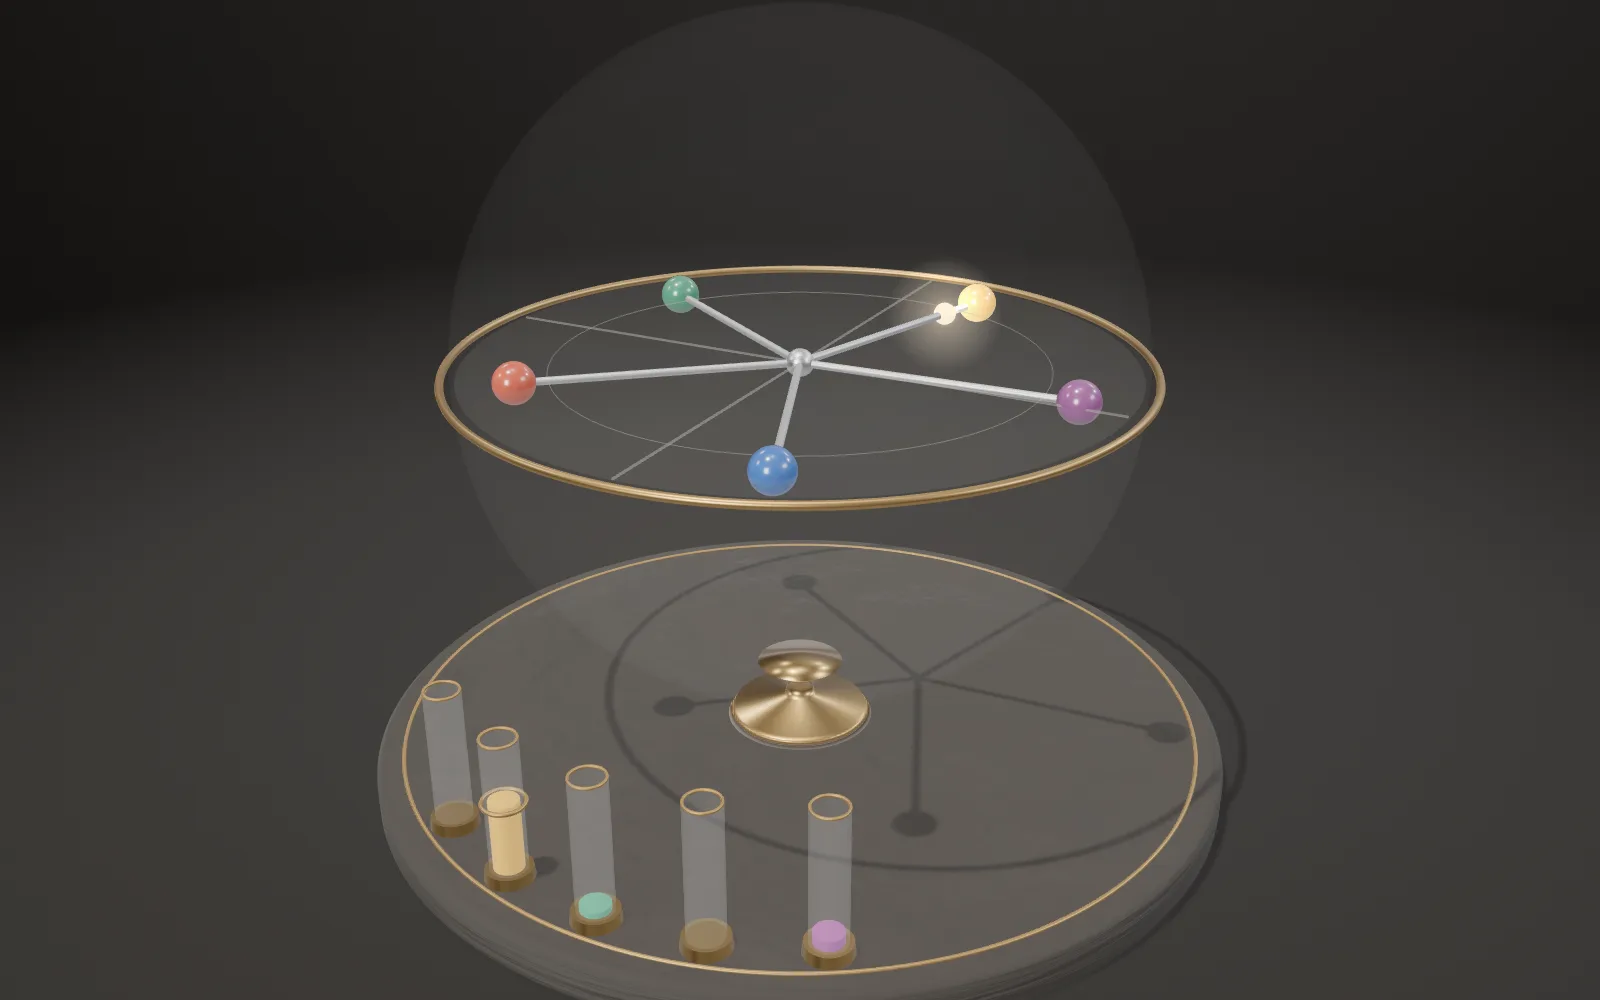
On the stand is a desk globe: the Earth in relief, a glass shell printed with the water in the atmosphere from one real forecast, and a corner of the northern atmosphere cut away to show its 13 pressure levels. The shell shows ECMWF’s AIFS forecast from 22 October 2025, 00 UTC, six hours a step; the pointer on the base shows the day.
GraphCast: 90.3 % of 1,380 targets over HRES (2018) · GenCast: 97.2 % of 1,320 over the ensemble (2019) · AIFS: operational since February 2025
Where a forecast starts
A forecast starts from a picture of the atmosphere now. GraphCast divides the Earth into a 0.25° latitude-longitude grid, 721 × 1440, or 1,038,240 points, a cell about 28 km across at the equator. Each point holds 5 surface variables and 6 variables on 37 pressure levels, 227 numbers in all; one moment is 235,680,480 numbers.
That picture is not measured directly. ECMWF receives around 800 million observations a day and, after quality control, gives around 60 million to its physics model IFS; data assimilation (4D-Var) combines them with the model’s last forecast into the best estimate of the atmosphere, the analysis. Live AIFS and GraphCast forecasts start from such an analysis.
The shell shows the water in the atmosphere in the analysis of 22 October, 00 UTC, as AIFS reads it in: the water vapour, cloud water and ice, rain and snow in a column from the ground to the top of the atmosphere, whiter where there is more. The glass is engraved with the 0.25° grid.
0.25° grid: 1,038,240 points · 227 numbers each · the start: an analysis made from observations and a physics model
How a physics model steps
A physics model starts from equations: momentum, heat, moisture and conservation of mass, which say how wind, temperature, humidity and pressure change next. ECMWF’s IFS divides the atmosphere into a grid about 9 km across, with 137 levels.
Processes smaller than a grid cell, such as radiation, turbulence, convection and clouds, can’t be computed directly; simplified formulas estimate them, called parametrizations. Time moves in small steps: ECMWF wrote in 2016 that its 9-km model steps 450 seconds at a time, so 6 hours take 48 steps and 10 days 1,920.
That takes a supercomputer. ECMWF’s Atos system in Bologna, Italy, has 7,680 compute nodes and 1,040,384 processor cores, and has made the operational forecasts since October 2022.
IFS: about 9 km · 137 levels · 450-second steps, 48 in 6 hours · 1,040,384 cores
One learned step
A learned model solves no equations. It reads the atmosphere at two moments, now and six hours ago, and computes the atmosphere six hours on in one go; then it reads its own result back as the new “now”, step after step. GraphCast takes 40 steps to reach 10 days, AIFS 60 steps to 15 days.
Its rules are a long list of numbers tuned in training, 36.7 million for GraphCast. Nobody writes the equations in; it learns from decades of the atmosphere’s changes what usually comes next.
On the stand the water on the shell jumps six hours at a time, and the pointer moves on a dial that goes round once in 10 days. Every step is one AIFS computed, not an in-between made up for the picture.
Now + six hours ago → six hours on · GraphCast: 40 steps to 10 days · AIFS: 60 steps to 15 days
The atmosphere cut open
The cut corner shows the forecast’s 13 pressure levels, from 1000 hPa near the ground to 50 hPa about 20 km up. Heights are raised 60 times and so are the mountains, so the low levels meet the plateaus and ranges as they do in the real atmosphere.
The colours of the cut faces are the temperature on 22 October, 00 UTC: warm below and colder upwards, coldest on the faces at 100 hPa about 16.6 km above the equator, near −83 °C, then a little warmer again. Towards the north the levels sink: 500 hPa is about 5,850 to 5,880 m up at the equator and about 5,280 m near the pole, because cold air is denser.
GraphCast uses 37 pressure levels; AIFS and this open data carry 13, and AIFS version 2 (May 2026) added 10 hPa; the IFS itself computes 137 levels.
13 pressure levels: 1000 → 50 hPa · heights × 60 · colours: temperature on 22 October, 00 UTC
Messages on a mesh
How GraphCast takes one step: an encoder hands the values of more than a million grid points to a mesh; a processor has connected nodes pass “messages” to each other, 16 rounds in all; a decoder hands the result back to the grid.
The mesh starts as an icosahedron and splits every triangle into four, six times over; the finest level has 40,962 nodes. GraphCast keeps every level’s edges in one mesh: the coarsest edges are about 7,000 km long, the finest about 110 km, 327,660 directed edges in all, so messages cross the globe in a few rounds.
The brass mesh on the stand shows only the first three levels, with 12, 42 and 162 nodes. AIFS uses graph networks like this to encode and decode, with a transformer of 16 layers on a grid of about 1° in between.
Encode → 16 rounds of messages → decode · 40,962 nodes · 327,660 directed edges
Learning from the past
They learn from ERA5: ECMWF’s record of the atmosphere since 1940, rebuilt from the observations with a physics model and data assimilation, one picture an hour, about 31 km across and 137 levels deep. This is called a reanalysis.
GraphCast trained on the 39 years from 1979 to 2017, for about four weeks on 32 TPU v4 chips. AIFS is pre-trained on ERA5 from 1979 to 2022, then fine-tuned on ECMWF’s operational analyses of recent years; AIFS Single version 1 used no observations directly in training.
So the learned models depend on the physics model: the records they learn from were made by it with observations, and so is the start of every forecast. ECMWF writes that because AIFS starts from the IFS analysis, changes to the IFS can change how AIFS performs.
ERA5: 1940 to now · hourly · about 31 km · 137 levels · GraphCast: 1979–2017
Many forecasts
The atmosphere is chaotic: a tiny difference at the start can grow into a large one a few days later. ECMWF says this limits detailed weather prediction to about a week or so ahead. So forecast centres run a set of forecasts at once: ECMWF’s ensemble has 51 members, one control and 50 with small changes to their start and their model.
GenCast is a diffusion model: it starts from random noise and removes it bit by bit until one possible weather is left; 50 runs make 50 members. It steps 12 hours at a time over 15 days, and one member takes about 8 minutes on a TPU v5. Tested on 2019, it beat ECMWF’s ensemble of the time on 97.2 % of 1,320 targets, and on 99.6 % beyond 36 hours.
On 1 July 2025 ECMWF’s AIFS ENS went into operation, also with 51 members. The fine lines on the globe are each AIFS ENS member’s 5,640 m contour from this start: a few days on, they spread apart.
51 members · GenCast: 97.2 % of 1,320 targets over the ensemble (2019) · AIFS ENS: operational since July 2025
How much faster
The GraphCast paper says it makes a 10-day forecast in under a minute on a single Google Cloud TPU v4; the figure it cites for HRES is about an hour on an 11,664-core computer. One GenCast member takes about 8 minutes, and members can run at the same time.
ECMWF says an AIFS forecast uses about a thousandth of the energy of the physics model’s.
These comparisons come with conditions: the hardware differs; training is left out, about four weeks on 32 TPUs for GraphCast; and so is data assimilation: a learned model still waits for the physics model to turn the observations into an analysis before it can start, which ECMWF wrote in 2017 takes several hours.
GraphCast: under 1 minute on one TPU (10 days) · HRES: about an hour on 11,664 cores (as cited) · AIFS: about a thousandth of the energy
What the scores show
Each paper scores against its own answer: GraphCast against ERA5, HRES against its own analysis. The AIFS paper scores AIFS and the IFS against the same operational analysis; in 2022 AIFS did about 10 % better through the troposphere, and the IFS better at 50 hPa.
A smaller error is not always better. A model trained on squared error blurs more the further it looks: when unsure, an average scores well. In this page’s one forecast, the small-scale detail of AIFS’s water field is down to 79 % of its start by day 5, while the IFS and the analyses keep theirs. The GraphCast paper also says it blurs at long lead times.
Tropical cyclones too: the AIFS paper finds its errors in a cyclone’s position clearly smaller than the IFS’s, and its errors in strength larger. The papers’ findings rest on a whole year of cases; in a single forecast either model can come out ahead.
Each against its own answer · blurrier further out, yet smaller errors · positions better, strength weaker
Taken apart
The stand comes apart in five pieces: the globe, the atmosphere shell, the brass mesh, the meridian arc with its pole pins, and the base.
The globe carries the relief of the land and the depth of the sea floor, raised 60 times. The atmosphere shell is glass printed with the water in the column; its cut corner has three faces painted with the temperature on the 13 pressure levels.
The brass mesh is the first three levels of GraphCast’s mesh, hung on the two pole pins; the dial on the base goes round once in 10 days, and its pointer shows the lead time of the step on the shell.
Globe · atmosphere shell · brass mesh · meridian arc and pins · base
Laboratory
The bench uses real forecasts: ECMWF’s AIFS (learned) and IFS (physics) from 22 October 2025, 00 UTC, and the analyses every 12 hours after it (what happened). As the lead time changes, the shell shows the water at that moment; the fine lines are 500 hPa contours, black the forecast, red what happened.
The readouts are the global root-mean-square error of the 500 hPa height (weighted by area), computed by this page from the 0.25° open data. This time AIFS has the smaller error for the first 7 days; from day 8 the IFS’s is a little smaller, and both are about 76 m on day 10.
This is one start time. Both forecasts are drawn on the 0.25° grid: AIFS works at about 31 km, the IFS at about 9 km, and some of the IFS’s detail is smoothed away here.
Lead time · AIFS / IFS / what happened · readout: 500 hPa height error
Try thisFrom the same start, roll the learned AIFS and the physics model IFS ten days ahead. On which day are their 500 hPa height errors about equal, and which of the two water fields looks smoother on day 10?
What the model leaves out
The atmosphere and the relief are raised 60 times; the real atmosphere is far thinner, with 50 hPa only about 20 km up. Total column water is the amount in a whole column; here it is printed on the outer glass, not at its height. The forecast on the shell is AIFS Single version 1.1’s, interpolated to 0.25° by ECMWF and averaged to 0.5° by the page; steps change over with a short dissolve. The brass mesh shows only the first 3 of the 7 levels of GraphCast’s mesh, and stands off the globe only so it can be seen: in the model its nodes lie on the Earth’s surface. No GraphCast output is shown; it is not an ECMWF operational forecast.
Easy to get wrong
A learned model does not do without physics: ERA5, which it learns from, was made by a physics model with observations, and every forecast starts from the physics model’s analysis. “Better on 90 % of targets” is not “90 % accurate”, nor better than forecasters: the papers compare against one year and one version of a physics model on chosen scores. Speed comparisons leave out training and data assimilation, on different hardware. Models trained on squared error blur, and part of their smaller error comes from that. Cyclone positions improve; strength is often too weak. A single forecast, like the one on the bench, says nothing about which model is better on average.
Common questions · 5
- How does AI weather forecasting work?
An AI weather model is a learned model: it reads decades of records of the atmosphere and learns to compute, from the atmosphere now, the atmosphere six hours later.
01What they can do ↑- What does “better on 90 % of targets” mean?
A target is one variable at one height and one lead time; 90.3 % is how many it won, not how accurate it is.
01What they can do ↑- What data do AI weather models learn from?
They learn from ERA5: ECMWF’s record of the atmosphere since 1940, rebuilt from the observations with a physics model and data assimilation, one picture an hour, about 31 km across and 137 levels deep.
07Learning from the past ↑- Why run a whole set of forecasts?
The atmosphere is chaotic: a tiny difference at the start can grow into a large one a few days later.
08Many forecasts ↑- How much faster is an AI weather forecast?
The GraphCast paper says it makes a 10-day forecast in under a minute on a single Google Cloud TPU v4; the figure it cites for HRES is about an hour on an 11,664-core computer.
09How much faster ↑
Sources
- Lam et al. (2023): Learning skillful medium-range global weather forecasting (GraphCast), Science 382
- Lam et al.: GraphCast (arXiv 2212.12794, with the supplement)
- Price et al. (2025): Probabilistic weather forecasting with machine learning (GenCast), Nature 637
- Lang et al. (2024): AIFS – ECMWF’s data-driven forecasting system
- ECMWF (2025-02-25): ECMWF’s AI forecasts become operational
- ECMWF (2025-07-01): ECMWF’s ensemble AI forecasts become operational
- ECMWF (2026-05-12): IFS cycle 50r1 and AIFS v2 go live
- ECMWF Newsletter 187: Implementation of AIFS v2
- ECMWF: Implementation of AIFS Single v1
- ECMWF (2016): Detailed information of implementation of IFS cycle 41r2 (9 km, 450 s time step)
- ECMWF (2023): Implementation of IFS Cycle 48r1 (9-km ensemble, 51 members)
- ECMWF: IFS Documentation CY49R1 (data assimilation, dynamics, physical processes)
- ECMWF: Supercomputer facility
- ECMWF (2026-09-03): From space to forecast (observations a day)
- ECMWF: Fact sheet on ensemble forecasting; Introduction to chaos, predictability and ensemble forecasts
- ECMWF: Introduction to chaos, predictability and ensemble forecasts
- ECMWF / C3S: ERA5 data documentation
- Hersbach et al. (2020): The ERA5 global reanalysis
- Rasp et al. (2024): WeatherBench 2
- ECMWF: Open data (CC BY 4.0)
- ECMWF real-time forecasts on the Registry of Open Data on AWS (read 2026-10-26)
- ECMWF parameter database: total column water (tcw)
Data
Forecast fields on the globe and in the laboratory are based on data and products of the European Centre for Medium-Range Weather Forecasts (ECMWF). © 2025 ECMWF. Licence: CC BY 4.0 (https://creativecommons.org/licenses/by/4.0/). Source: ECMWF open data (AIFS Single v1.1 and IFS cycle 49r1, run of 22 October 2025 00 UTC, and the IFS analyses up to 1 November 2025), read from the AWS Open Data mirror (https://registry.opendata.aws/ecmwf-forecasts, https://doi.org/10.21957/open-data). Changed: averaged from 0.25° to 0.5° and 1°, coloured and compared by world.lapla.si (docs/plates/weatherai/data). ECMWF does not accept any liability whatsoever for any error or omission in the data, their availability, or for any loss or damage arising from their use. Relief and sea floor on the globe: the site’s 0.5° elevation grid (as on the tides and quakes plates), raised ×60 like the atmosphere. Material presets, parts and the softbox studio of the site’s model kit are ported from AirsupHQ/machine-skill (MIT, © 2026 Air Supply Technologies Inc.).
The text, pictures and models on this page are licensed CC BY-NC 4.0: free to use and adapt for teaching and other non-commercial purposes, with credit to world.lapla.si. Third-party material listed above keeps its own licence.
Cite this plate
Laplace’s Mini World, Plate F49, “AI Weather Forecasting”, https://world.lapla.si/en/weatherai/, CC BY-NC 4.0, updated 2026-10-26.
Follow the question
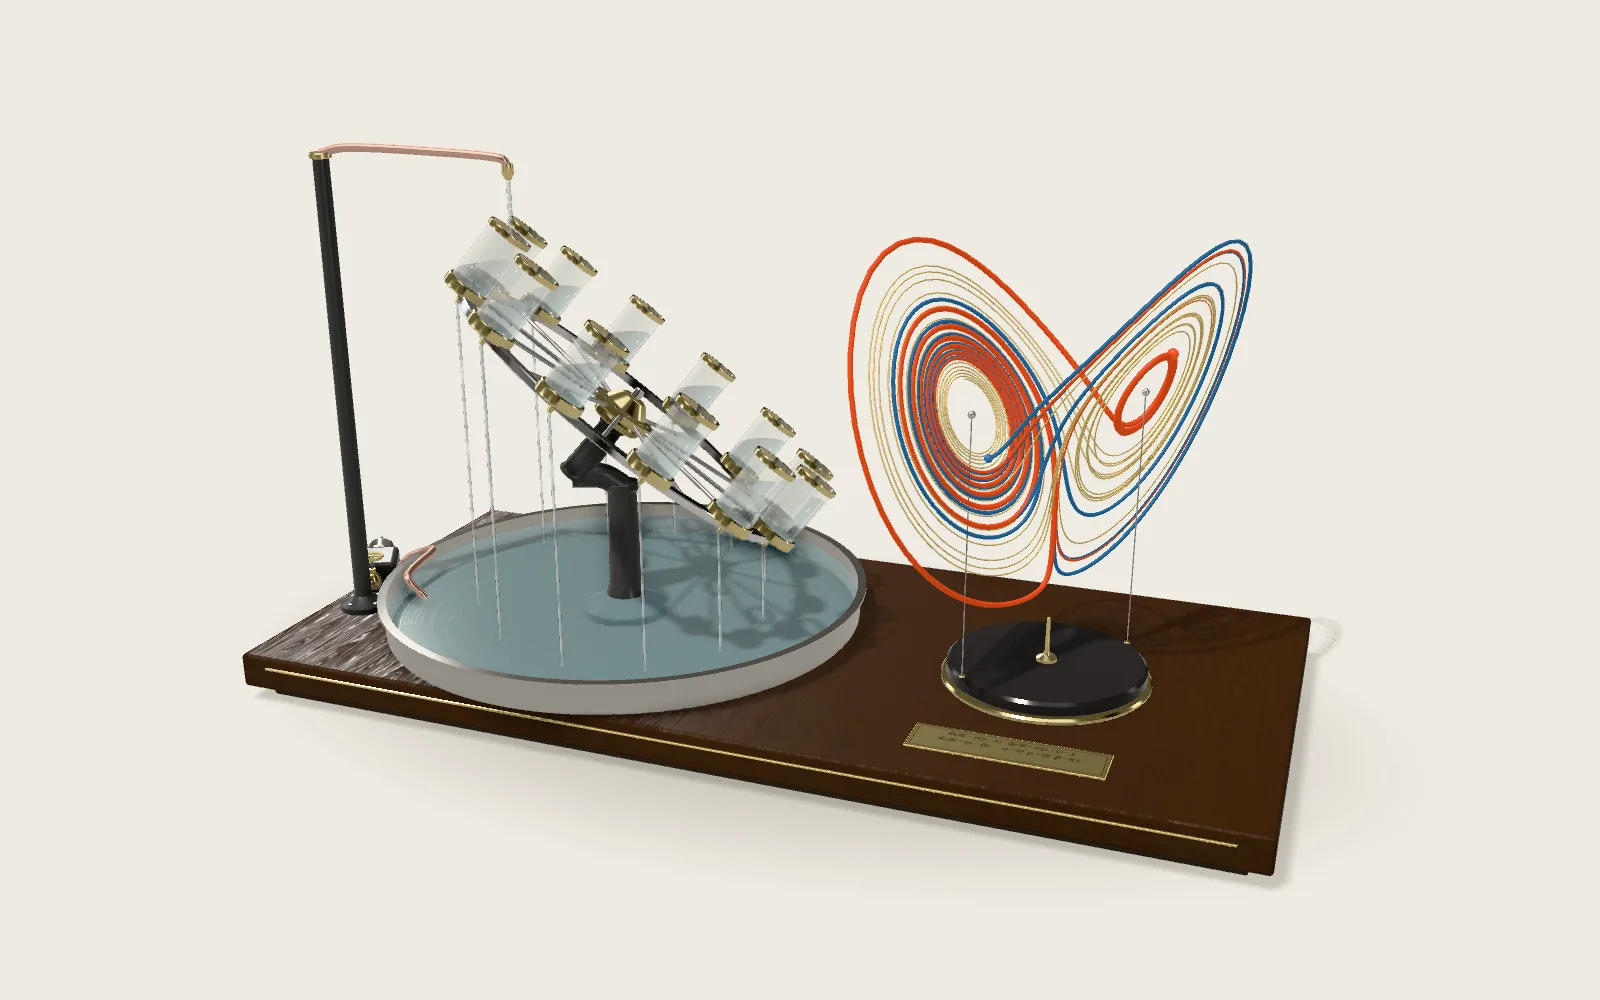 Plate M07Determined, Yet UnpredictableThree simple equations, nothing random in them. Two starts a millionth apart have nothing in common twenty time units later.
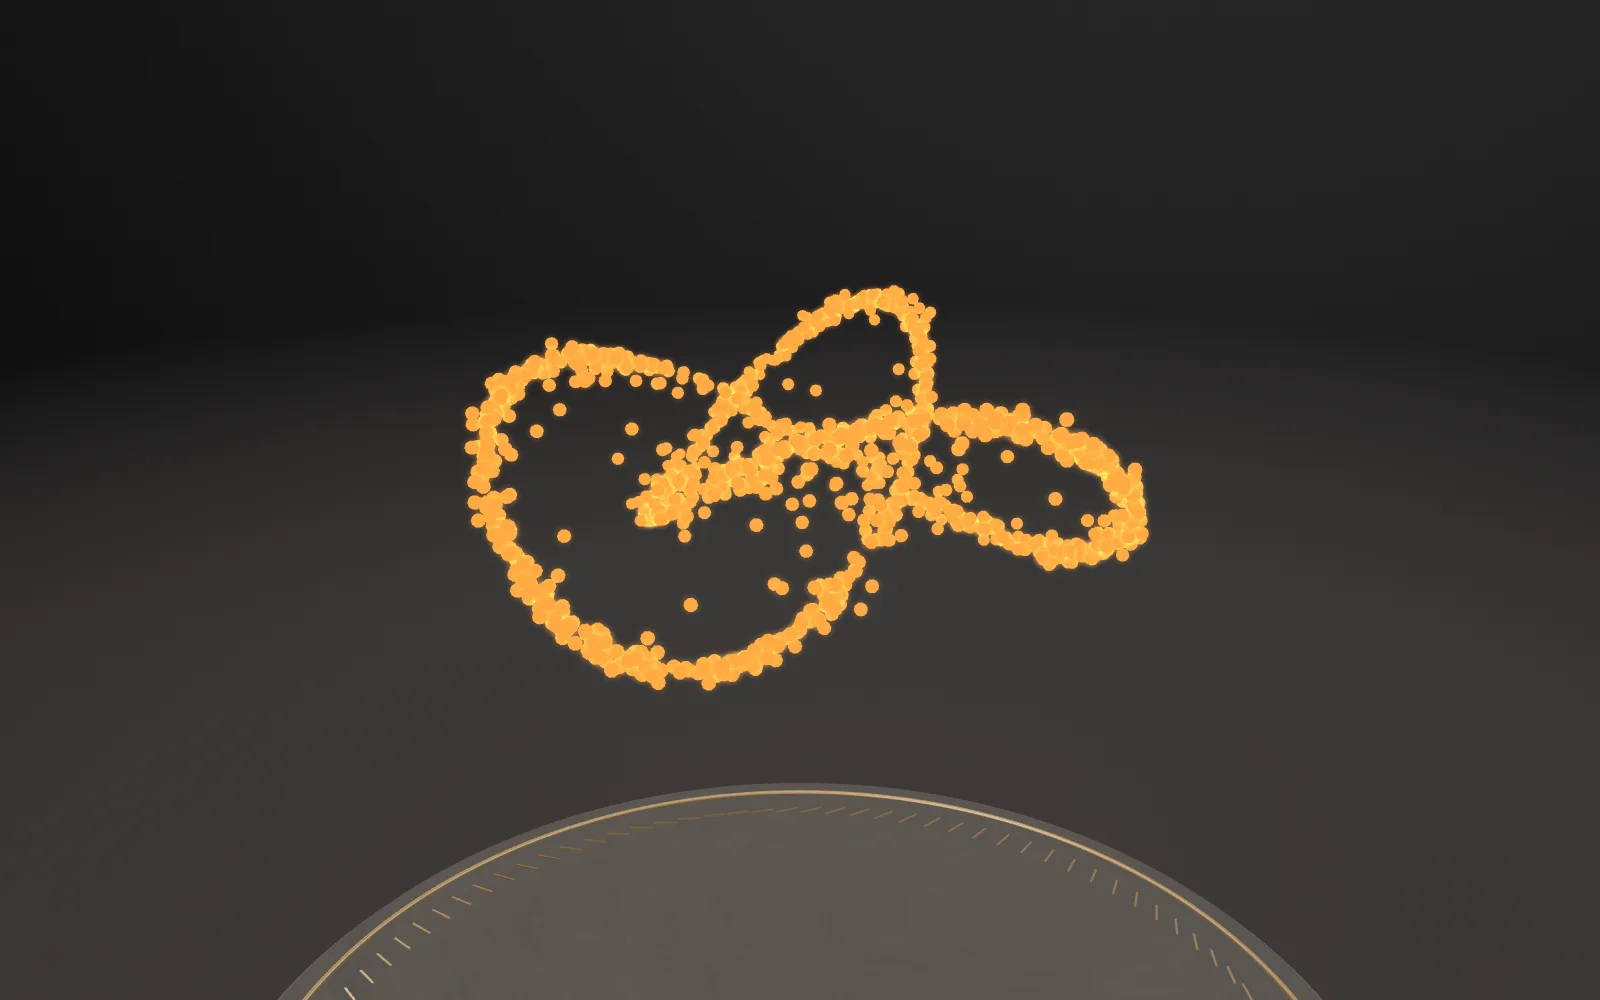 Plate 44Pictures Out of NoiseMany AI image generators start from random static and remove it, one step at a time. A small network does the same in your browser, and a cloud of dots slowly condenses into a knot.
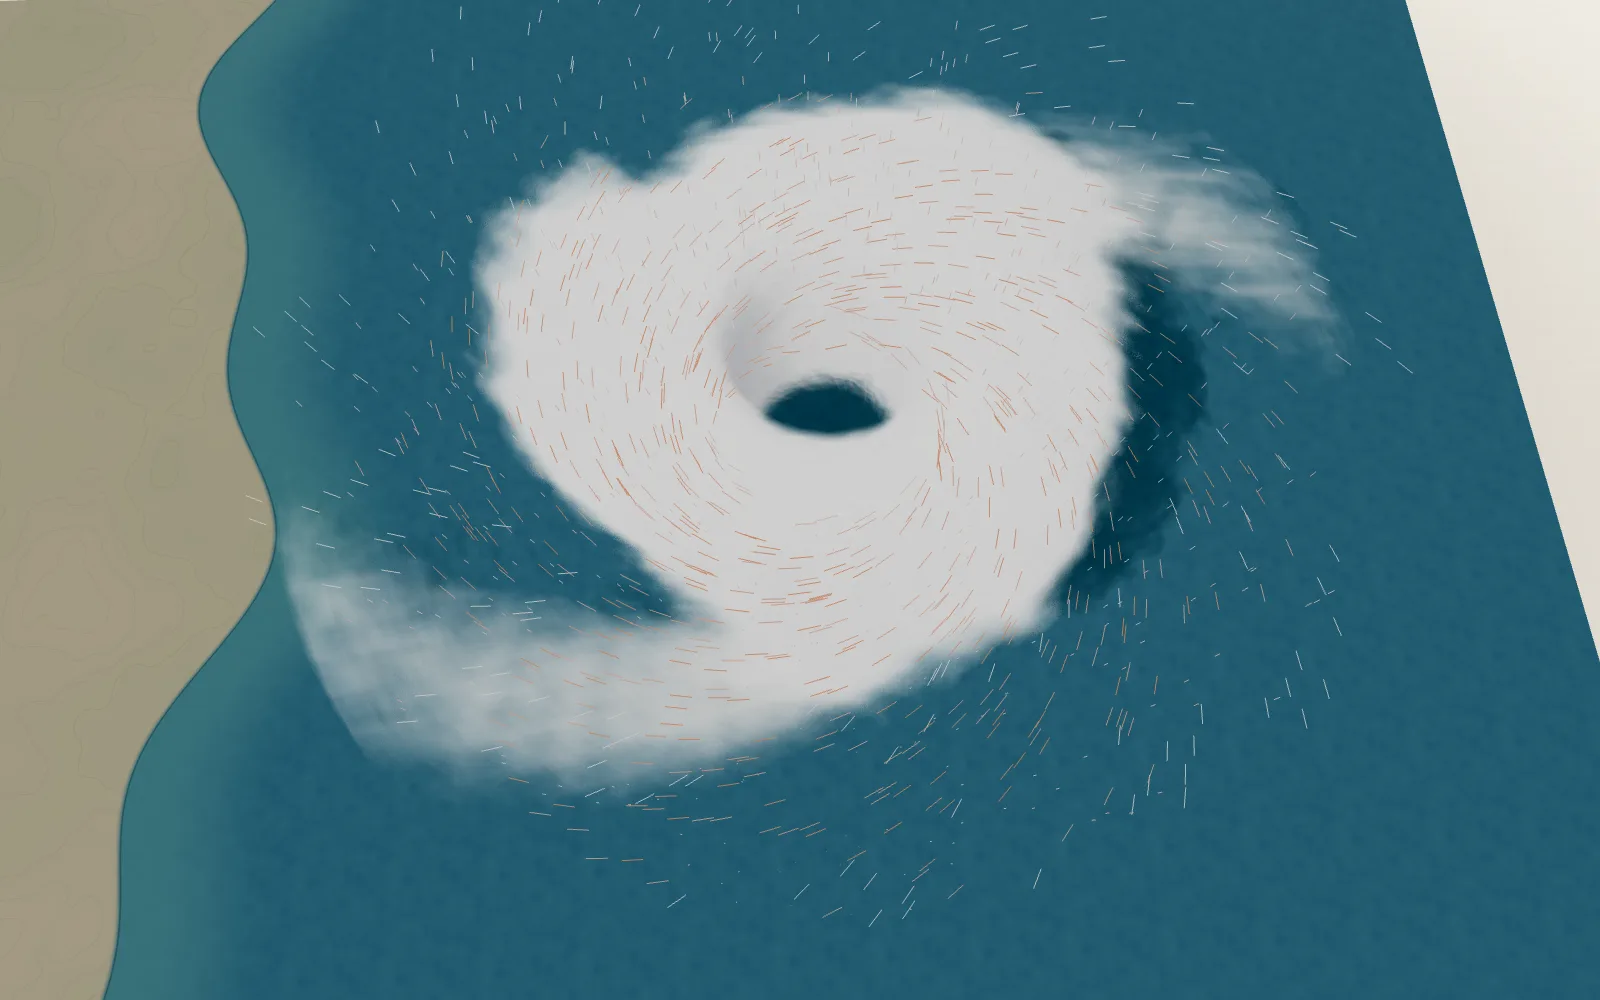 Plate 04The Engine of a HurricaneIt runs on warm water, and the turning Earth sets it spinning.
 Plate F13Attention in TransformersA two-layer, eight-head Transformer reads a sentence in your browser, one character at a time, and guesses the next. Each thread is one act of attention; its brightness is the weight.