Plate 04 · Sky
The Engine of a Hurricane
It runs on warm water, and the turning Earth sets it spinning. Above the patch of ocean below, a storm is taking shape.
Scroll
The Warmth of the Sea Is the Fuel
Hurricanes form only over warm ocean: the water must be at least 26.5°C (80°F), and warm to a good depth.
Warm seas give off vast amounts of water vapor. Moist air rises and cools, the vapor condenses into cloud and rain, and in doing so releases heat. That heat makes the air lighter, so it rises faster and draws in still more moist air from the sea. It is a heat engine, and its fuel is the warmth of the sea.
Model storm · sea colored by water temperature · heights exaggerated
The Spinning Earth Sets It Turning
Air rushes in from every side toward the low pressure at the center. Because the Earth is turning, those currents are deflected to the right in the Northern Hemisphere (to the left in the south), so instead of flowing straight in they swirl around the center: counter-clockwise in the north, clockwise in the south.
Near the sea, air spirals in; high above, it spirals out.
The Eye
As the storm tightens, its center empties. In the eye the winds are light, the air sinks slowly and the clouds thin out; most eyes are 30 to 60 kilometers across.
Around it stands the eyewall, a towering ring of cloud that holds the strongest winds of the whole storm.
The storm cut open · heights exaggerated
No Hurricanes at the Equator
Near the equator, the deflection from the Earth’s rotation all but vanishes. Air simply flows straight into the low and fills it, and no storm can spin up. That is why hurricanes almost never form within about 500 kilometers of the equator.
Move the storm into the Southern Hemisphere and it turns the other way, clockwise.
After Landfall
Once a hurricane moves over land, or into cold water, it is cut off from its fuel, and its winds fall away within a day or so.
Its rain and floods, though, can still do serious harm far inland.
Isabel, 2003
In early September 2003, Isabel formed over the Atlantic west of the Cape Verde Islands and tracked west, strengthening as it crossed warm water. On September 11 its maximum sustained winds reached about 270 kilometers an hour, the top of the scale: Category 5.
It then weakened, and on September 18 came ashore in North Carolina as a Category 2 hurricane. Less than a day after landfall it had fallen to a tropical storm.
Track and winds: U.S. National Hurricane Center, HURDAT2 best-track data
Your Turn
Warm the sea or cool it, push the storm toward the equator or into the other hemisphere, then send it ashore and watch what happens.
Try thisDrag the latitude close to the equator: what becomes of the storm?
What the model leaves out
This is a teaching model, not a forecast. The storm’s strength depends only on the sea temperature, the latitude and whether it is over land; the wind is an idealized vortex and the clouds are illustrative. Real hurricanes also depend on wind shear aloft, humidity, the heat stored in the upper ocean and much else. The rate at which winds fall over land is tuned to Isabel’s measured winds after landfall. Heights are greatly exaggerated.
A common misreading
The eye is not the most dangerous part of a hurricane but the calmest; the strongest winds are in the eyewall around it. For that very reason, when the eye passes overhead the wind suddenly drops — but the storm is not over. Minutes or an hour or two later the far side of the eyewall arrives, and the wind returns from the opposite direction.
Sources
- NOAA AOML: What conditions are needed for a tropical cyclone to form?
- NOAA AOML: What is the eye, and the eyewall?
- NOAA National Ocean Service: hurricanes, typhoons and cyclones
- National Hurricane Center: the Saffir-Simpson Hurricane Wind Scale
- National Weather Service: hurricane safety
- NOAA: an empirical model of wind decay after landfall
- National Hurricane Center: HURDAT2 best-track data
Data
Storm track: National Hurricane Center, HURDAT2 Atlantic best-track data. Elevation and seafloor: Terrain Tiles on AWS Open Data (Mapzen / Tilezen); global ETOPO1 terrain data U.S. National Oceanic and Atmospheric Administration; GMTED2010 and SRTM courtesy of the U.S. Geological Survey.
Follow the question
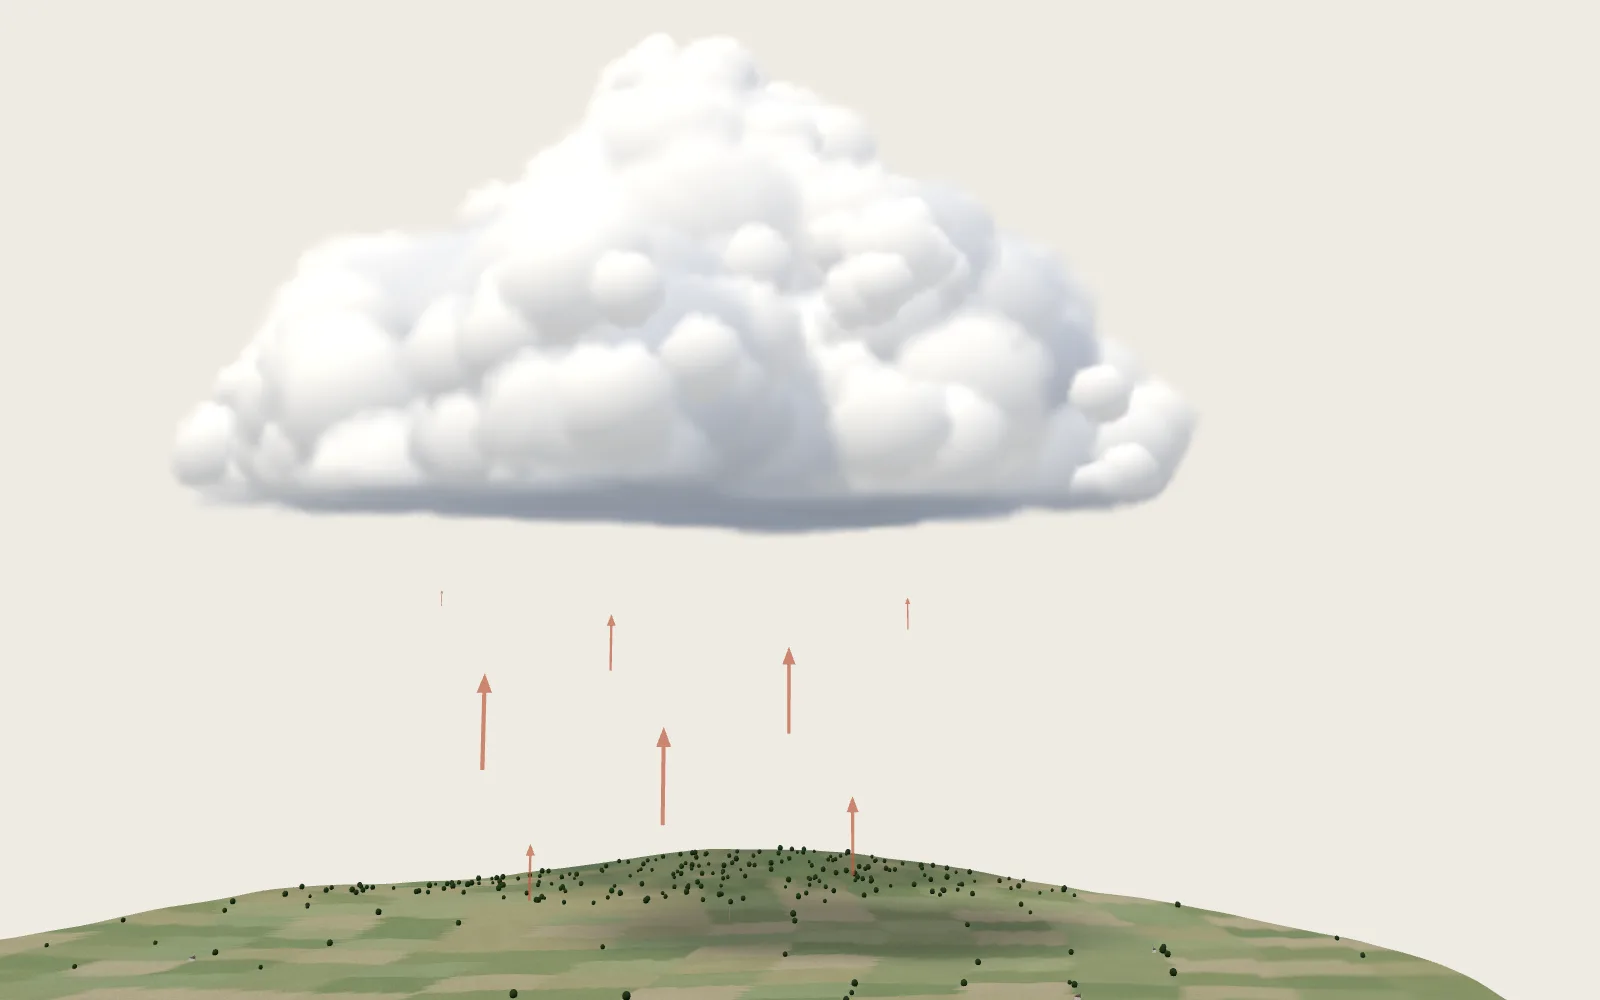 Plate 30Why Clouds Don’t FallAn ordinary cumulus cloud holds hundreds of tonnes of water, yet it floats. The secret is how astonishingly small its droplets are.
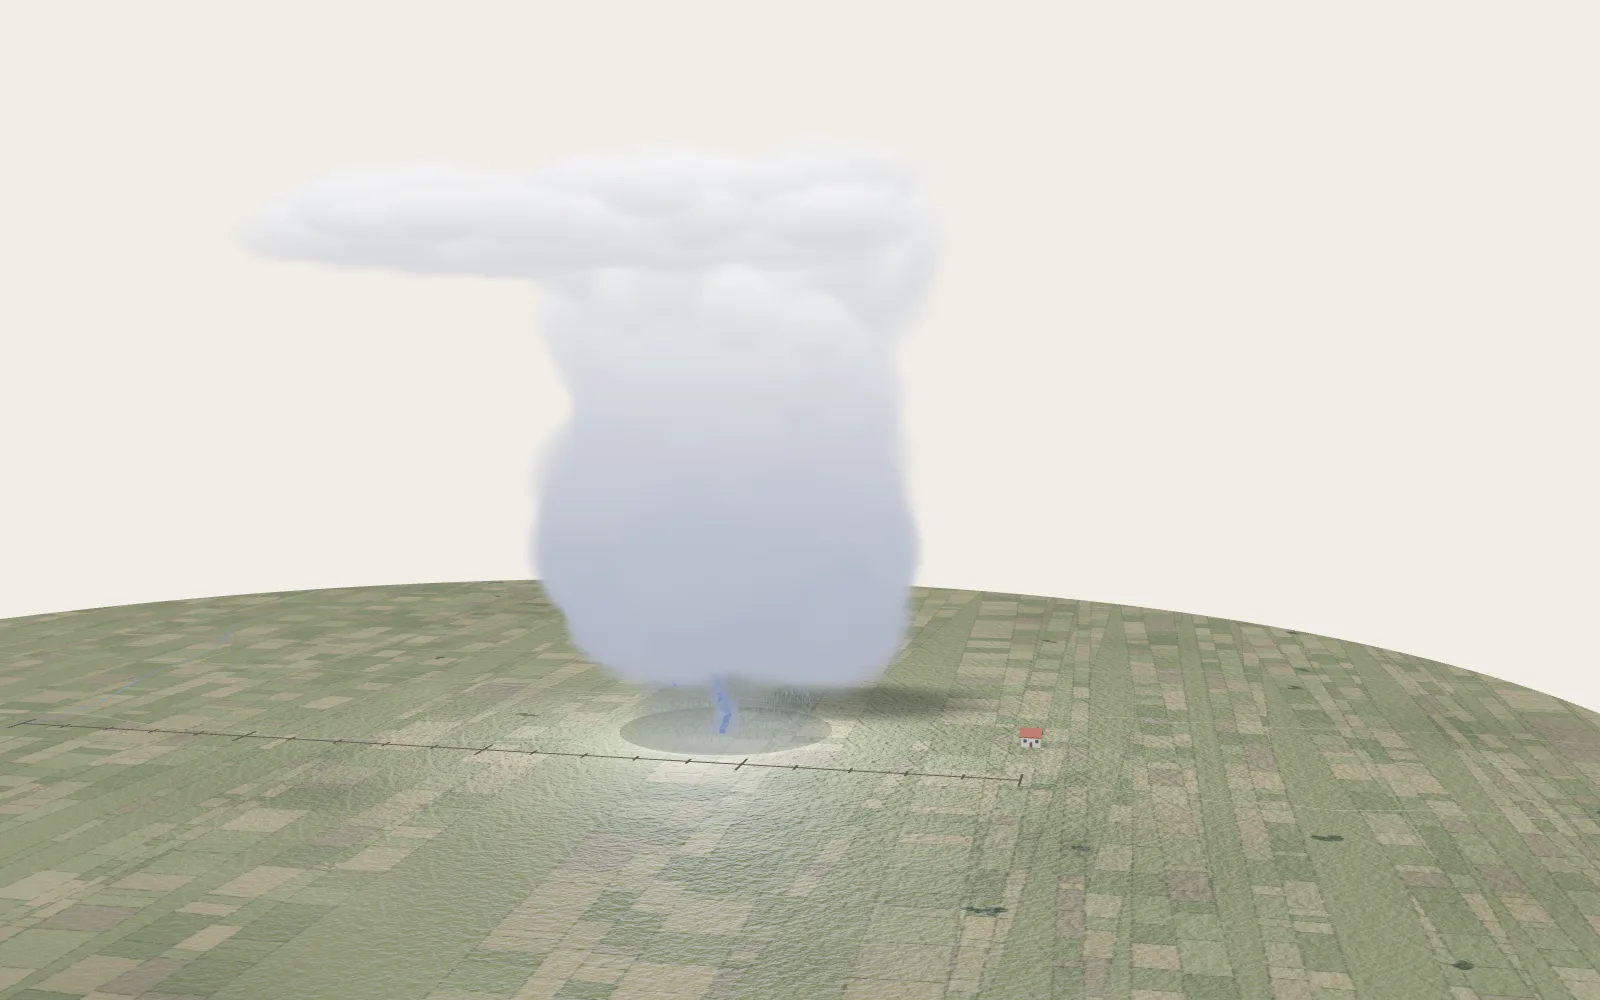 Plate 33See the Flash, Then Hear the ThunderLightning and thunder happen at the same moment, but light arrives almost at once while sound covers only about 340 metres a second. Count the seconds between them and you know how far away the storm is.