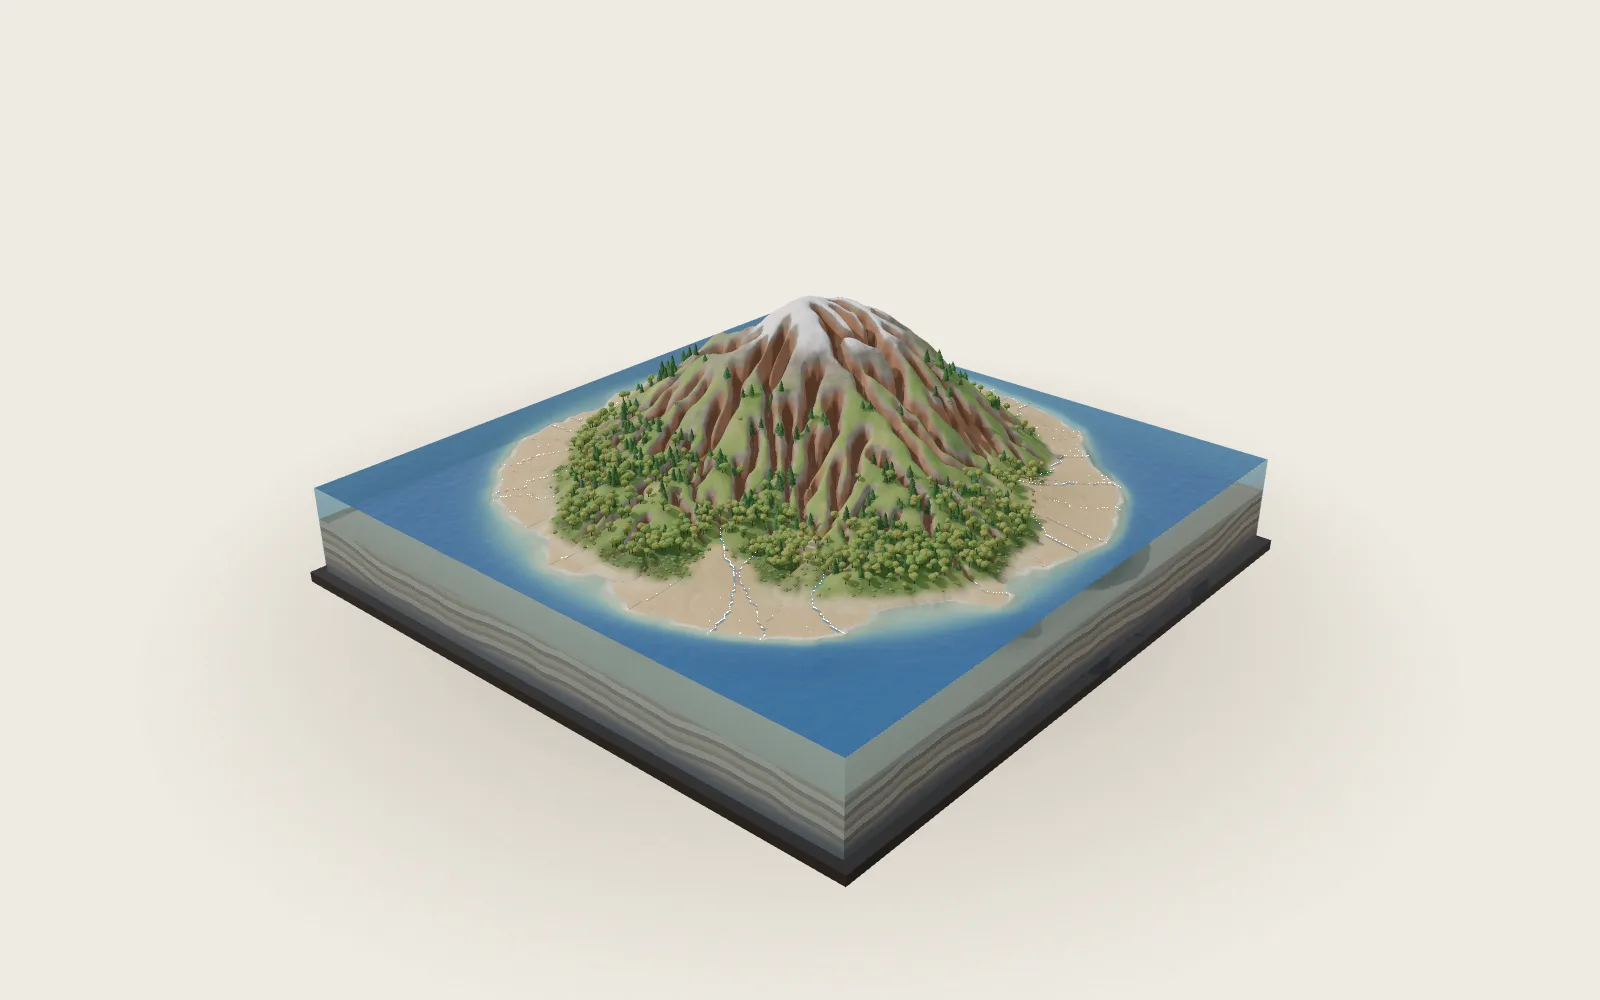
The Greenhouse Effect
Sunlight warms the ground, and the ground glows in infrared. Water vapour and carbon dioxide absorb part of it and send some back down, so the surface is about 33 °C warmer.
Chapters · 13
Scroll
A Brass Tube, 1859
In the spring of 1859, at the Royal Institution in London, John Tyndall set out to measure whether the gases of the air can stop invisible heat radiation. At the heart of his apparatus was a brass tube, polished inside, 4 feet long (about 1.2 m) and 2.4 inches across, closed at both ends with plates of rock salt: glass stops this radiation, rock salt does not.
At one end stood a copper cube full of boiling water, its face towards the tube coated with lampblack; at the other a thermopile, which turns the heat falling on it into a feeble current that moves the needle of a galvanometer.
With the tube full of dry air, oxygen, nitrogen or hydrogen, the needle moved about 1°. Comparing gases at one atmosphere in 1862, he found carbon dioxide stopped about 90 times as much heat as dry air, and ammonia about 1,195 times. Three years earlier, in America, Eunice Foote had found that a glass cylinder of carbon dioxide grew hotter in the sun; but she used sunlight, and could not tell how the heat got in.
Dry air, oxygen, nitrogen, hydrogen: about 1° · at one atmosphere, carbon dioxide about 90 times dry air (1862)
A Tug of Heat
A tiny absorption is measured by comparison. The thermopile has a conical reflector on each face: one gathers the heat coming down the tube, the other the heat of a second cube of boiling water. When the two are equal, the galvanometer needle rests at 0°.
First the tube is pumped empty and a double screen is moved until the needle is back at zero. Then the gas goes in: it stops part of the heat, the tube’s side weakens, the other side wins, and the needle swings. How far it swings says how much was stopped.
Undried air from the laboratory absorbed 15 times as much as dry air, which Tyndall put down mainly to water vapour. On 10 June 1859, at the Royal Institution, he threw the shadow of the galvanometer’s dial onto a screen and showed it live.
Two streams of heat cancel on the pile, the needle at 0° · gas in, the tube’s side weakens, the needle swings (schematic)
Nitrogen and Oxygen Let It Through
Most of the air is nitrogen and oxygen, and they absorb almost no thermal infrared. The reason is their shape: two identical atoms joined together share their charge evenly, and however they stretch, neither end becomes more positive or negative, so infrared has nothing to grip.
Carbon dioxide is a straight line: oxygen, carbon, oxygen. When it bends, the centres of positive and negative charge move apart, and it absorbs infrared near 15 µm; when one side stretches as the other shrinks, it absorbs near 4.3 µm. A water molecule is bent to begin with, one end more positive than the other, and it absorbs over far wider bands.
A molecule that absorbs infrared almost never gets the chance to give it back as it was: within a collision it hands the energy to the air around it, which warms. And in that warm air the same molecules keep sending infrared out in every direction.
N₂, O₂: almost no absorption · CO₂ bending: near 15 µm · H₂O: several broad bands
Sunlight In
Now the whole planet. At the top of the atmosphere, averaged over the year and the globe, each square metre receives about 340 W of sunlight.
About 100 W of it is reflected straight back to space by clouds, ice and snow, air and ground: about 29 %. The other 240 W or so is absorbed: about 80 W by the air, about 160 W by the ground.
On this column of air, the width of each band is the size of the flow. Yellow is sunlight, coming in at the top; some turns back at the clouds, some reaches the ground. The numbers are the IPCC’s Sixth Assessment Report, for the start of the 21st century.
Top of the atmosphere: about 340 in, 100 reflected, 240 absorbed, in W/m² · about 80 by the air, 160 by the ground (IPCC AR6)
Minus Eighteen
The hotter a body, the more it radiates: by the Stefan–Boltzmann law, in proportion to the fourth power of its absolute temperature. Earth absorbs about 240 W on each square metre, and has to send about 240 W out again, or it would keep warming.
A black body sending out 240 W/m² has a temperature of about 255 K, which is −18 °C (computed here). Yet the global average temperature at the surface is about 15 °C: about 33 °C higher.
Those extra 33 °C or so are the greenhouse effect. It is a reference for comparison: the same sunlight reflected, only the air absorbs no infrared. It is not the temperature Earth would have with no air at all.
240 W/m² → about 255 K, −18 °C (computed) · surface average about 15 °C · a gap of about 33 °C
The Ground Glows in Infrared
The Sun’s surface is at about 5,770 K, and its light is brightest in the visible, near 0.5 µm. The ground is only at some 15 °C; what it gives off is invisible thermal infrared, brightest near 10 µm (by Wien’s law, computed here).
The two hardly overlap. As black bodies, about 99 % of the Sun’s energy lies below 4 µm and about 99.9 % of the ground’s above it, which is why they are called shortwave and longwave.
The ground sends about 398 W of infrared up from each square metre, more than twice the sunlight it absorbs. It does not cool down for it, because the air is sending infrared down too. Rising warm air and evaporating water take another 103 W or so from the ground.
Sun about 5,770 K: peak near 0.5 µm · ground about 288 K: peak near 10 µm (computed) · about 398 W/m² up from the ground
Bands and a Window
Water vapour, carbon dioxide and ozone each absorb infrared in their own bands. Carbon dioxide’s most important band lies near 15 µm, right where the ground radiates most; water vapour absorbs a band near 6.3 µm, and has broad bands at longer wavelengths too.
Between about 8 and 13 µm the air is fairly clear to infrared: the atmospheric window. Ozone blocks a slice of it near 9.6 µm. Some of the ground’s infrared escapes through the window straight to space.
What Tyndall measured in 1859–1862 was the absorption of all wavelengths together; his apparatus did not separate them. The bands were measured one by one later, with spectrometers.
CO₂: near 15 µm · H₂O: near 6.3 µm and longer · the window: about 8–13 µm · O₃: near 9.6 µm
Some Comes Back Down
The air that absorbs infrared warms, and radiates infrared both up and down. The downward share reaching each square metre of ground is about 342 W, more than twice the sunlight the ground absorbs.
Only about 239 W of infrared leaves the planet at the top. Most of it comes from air high up, far colder than the ground, which radiates less. The difference between the 398 W the ground sends up and the 239 W that leaves, about 159 W, is the size of the greenhouse effect.
In 1862 Tyndall compared the atmosphere to a dam across a river: it raises the level, but the water does not pile up for ever; in the end as much flows away as flows in. Likewise the heat Earth finally sends back to space equals the sunlight it absorbs.
Up from the ground about 398 · down about 342 · leaving the planet about 239, in W/m² · the greenhouse effect about 159 W/m² (IPCC AR6)
Almost in Balance
Draw in everything that comes and goes, and you have Earth’s energy budget. The ground absorbs about 160 W/m² of sunlight and receives about 342 of infrared from above; it radiates about 398, loses about 82 to evaporation and about 21 to warm air. At the top, about 340 comes in, and about 100 of reflected sunlight and 239 of infrared go out.
The two sides almost cancel, but not quite. Averaged over 2006–2018, Earth took in about 0.79 W more than it gave out on each square metre (0.52–1.06), and about 91 % of that extra heat went into the ocean. Satellites and ocean floats both found the gap roughly doubled between 2005 and 2019.
As long as the gap remains, Earth keeps warming, until the infrared it sends out catches up with the sunlight it absorbs.
In about 340 · out about 100 + 239 · gap about 0.7 (AR6 Figure 7.2) · about 0.79 W/m² in 2006–2018 · about 91 % into the ocean
Where a Year’s Carbon Goes
The carbon in coal, oil and gas lay buried for millions of years; burning them turns it into carbon dioxide in the air. In 2024 fossil fuels released about 10.3 billion tonnes of carbon (about 37.8 billion tonnes of carbon dioxide), and land-use change, such as clearing forests, about 1.3 billion more.
Averaged over 2015–2024, about 11.2 billion tonnes of carbon a year went out: about half stayed in the air, about 29 % was taken up by the ocean and about 21 % by plants and soils on land. The dark bands on the front of the column follow that average.
The half that stays has taken carbon dioxide from about 278 ppm in 1750 to about 426 ppm in 2025 (global annual mean), the highest in at least 2 million years. The yearly breath of the seasons is on the plate “The Breathing Planet”. The ocean pays for what it takes up: the pH of its surface water has fallen by about 0.1.
2015–2024 means: about 11.2 billion tonnes of carbon a year · air 50 % · ocean 29 % · land 21 % (Global Carbon Budget 2025)
Doubling Carbon Dioxide
Each doubling of carbon dioxide adds about 3.93 W/m² (±0.47) of effective radiative forcing at the top of the atmosphere: before the surface warms, the infrared going out to space falls short by that much. From 1750 to 2019, carbon dioxide added about 2.16 W/m² of forcing, and all human activity about 2.72.
The forcing grows roughly with the logarithm of the concentration: going from 280 to 560 ppm adds about as much as going from 560 to 1,120. Carbon dioxide’s absorption is far from saturated: the more there is, the more the wings of the 15 µm band absorb, and the higher and colder the layer that radiates to space.
The surface has to warm until it makes up the shortfall. The IPCC’s best estimate for the warming from doubled carbon dioxide, once things settle, is 3 °C, likely 2.5–4 °C and very likely 2–5 °C. Over 2011–2020 the globe was already about 1.09 °C warmer than in 1850–1900.
One doubling: about 3.93 W/m² (IPCC AR6) · eventual warming: best 3 °C, likely 2.5–4 °C, very likely 2–5 °C
The Apparatus Taken Apart
First the galvanometer moves away and the thermopile lifts with its two conical reflectors; then the double screen, the compensating cube and the rock-salt plate at S′; then the tube rises, and last the source with its front chamber, and the gas holder with the drying tubes.
Whichever part the pointer rests on is lifted alone and named; when it is still, the parts are lifted in turn.
Galvanometer · thermopile · double screen · compensating cube · rock-salt plate · tube · heat source · gas train
Set the Carbon Dioxide
Readout one is the forcing against 1750 (about 278 ppm), at 3.93 W/m² for each doubling, on the logarithm of the concentration. Readout two is the eventual warming at the IPCC’s best estimate, 3 °C for each doubling. Readout three is the range for the likely 2.5–4 °C.
Each time it is changed or this section opens, the column starts again from 1750’s level: first the infrared leaving the planet falls short, then the surface slowly warms until it is made up. The clock is schematic, not years.
Forcing = 3.93 × log₂(C ÷ 278.3) W/m² (computed) · warming by the IPCC’s climate sensitivity · the clock is schematic
Try thisTake carbon dioxide from 278 ppm to 557 ppm: how much forcing does that add at the top of the air, and how much does the surface eventually warm on the IPCC’s likely range?
What the model leaves out
There are two exhibits on the table. The apparatus follows the description and plate in Tyndall’s paper of 1861; the tube is drawn shorter than his 4 feet, and the gas train and the galvanometer are set closer than his. A window is cut in the tube’s wall, and the red band inside is a schematic of the heat radiation, not visible light. The papers do not give the sizes of the cubes, the pile and the cones; they are judged from the plate. The column of air is not to scale: the depth of the air and the height of the clouds are squeezed. The bands are drawn to global annual means (energy in W/m², carbon in billions of tonnes), and real flows vary greatly with place, season and time of day. The infrared that escapes from the ground straight through the window is not drawn on its own. The lab takes the forcing as a logarithm and the eventual warming from the IPCC’s equilibrium climate sensitivity; it leaves out the delay from heat going into the ocean.
A few common misreadings
The greenhouse effect is named after greenhouses, but a garden greenhouse warms mainly because its glass stops the warm air from moving away; R. W. Wood compared glass and rock-salt covers in 1909. Carbon dioxide does not trap heat for ever: it absorbs infrared and gives it off again, and in the end Earth sends back to space as much heat as it absorbs sunlight, only at a higher temperature. Nitrogen and oxygen do absorb, very weakly. Water vapour is the largest absorber, but the amount in the air is set by the temperature and falls out within about ten days, so it amplifies warming rather than starting it. The ozone hole is a different problem, and not the main cause of global warming. Tyndall did not come up with the idea of the greenhouse effect, which Fourier had in the 1820s; he was the first to measure in a laboratory which gases absorb heat radiation.
Common questions · 5
- How cold would Earth be without the greenhouse effect?
A black body sending out 240 W/m² has a temperature of about 255 K, which is −18 °C (computed here).
05Minus Eighteen ↑- Why are nitrogen and oxygen not greenhouse gases?
Most of the air is nitrogen and oxygen, and they absorb almost no thermal infrared.
03Nitrogen and Oxygen Let It Through ↑- Where does the carbon dioxide people release go?
Averaged over 2015–2024, about 11.2 billion tonnes of carbon a year went out: about half stayed in the air, about 29 % was taken up by the ocean and about 21 % by plants and soils on land.
10Where a Year’s Carbon Goes ↑- How much would doubled carbon dioxide eventually warm Earth?
The IPCC’s best estimate for the warming from doubled carbon dioxide, once things settle, is 3 °C, likely 2.5–4 °C and very likely 2–5 °C.
11Doubling Carbon Dioxide ↑- Who first measured gases absorbing heat radiation in a laboratory?
In the spring of 1859, at the Royal Institution in London, John Tyndall set out to measure whether the gases of the air can stop invisible heat radiation.
01A Brass Tube, 1859 ↑
Sources
- J. Tyndall (1861): On the Absorption and Radiation of Heat by Gases and Vapours… (the Bakerian Lecture), Phil. Trans. 151, 1 (the apparatus, about 1° for dry air, water vapour)
- J. Tyndall (1861): Phil. Trans. 151, Plate I (C. Becker del., J. Basire sc.)
- J. Tyndall (1859): Note on the Transmission of Radiant Heat through Gaseous Bodies, Proc. R. Soc. 10, 37 (received 26 May 1859)
- J. Tyndall (1862): On the Absorption and Radiation of Heat by Gaseous Matter, Second Memoir, Phil. Trans. 152, 59 (absorptions at one atmosphere, the rock salt, the front chamber, the “dam”)
- J. Tyndall (1873): Contributions to Molecular Physics in the Domain of Radiant Heat (the demonstration of 10 June 1859)
- J. Tyndall (1863): Heat Considered as a Mode of Motion (the pile and the galvanometer)
- Royal Institution: John Tyndall’s radiant heat apparatus (collection page)
- E. Foote (1856): Circumstances affecting the Heat of the Sun’s Rays, Am. J. Sci. 22, 382
- M. Shapiro (2021): Eunice Newton Foote’s nearly forgotten discovery, Physics Today
- S. Weart: The Discovery of Global Warming, The Carbon Dioxide Greenhouse Effect, American Institute of Physics
- R. T. Pierrehumbert (2011): Infrared radiation and planetary temperature, Physics Today 64(1), 33
- M. Höpfner et al. (2012): The natural greenhouse effect of atmospheric oxygen (O₂) and nitrogen (N₂), GRL 39, L10706
- NIST CCCBDB: experimental vibrational frequencies (CO₂, H₂O, O₃)
- R. W. Wood (1909): Note on the Theory of the Greenhouse, Phil. Mag. 17, 319
- IPCC (2021): AR6 Working Group I, chapter 7 (the energy budget, Figure 7.2; the greenhouse effect of 159 W/m²; forcing; the energy imbalance)
- IPCC (2021): AR6 Working Group I, Summary for Policymakers (climate sensitivity, the warming so far, the highest in 2 million years)
- IPCC (2021): AR6 Working Group I, chapter 2 (278.3 ppm in 1750)
- IPCC (2021): AR6 Working Group I, chapter 5 (the airborne fraction, ocean acidification)
- IPCC (2021): AR6 Working Group I, Annex VII, Glossary (greenhouse effect; the Sun at about 5,770 K)
- IPCC (2013): AR5 Working Group I, chapter 8, FAQ 8.1 (water vapour as a feedback)
- NASA Earth Observatory: Climate and Earth’s Energy Budget (about 29 % reflected, the window)
- NASA: Earth Fact Sheet (solar irradiance 1,361 W/m², Bond albedo 0.294, 288 K)
- G. Schmidt (2010): Taking the Measure of the Greenhouse Effect, NASA GISS (water vapour about half, clouds a quarter, CO₂ a fifth)
- N. G. Loeb et al. (2021): Satellite and Ocean Data Reveal Marked Increase in Earth’s Heating Rate, GRL 48
- P. Friedlingstein et al. (2026): Global Carbon Budget 2025, Earth Syst. Sci. Data 18, 3211 (the 2015–2024 means, 2024)
- NOAA Global Monitoring Laboratory: Trends in atmospheric carbon dioxide (425.62 ppm, the 2025 global annual mean)
- WMO and UNEP (2022): Twenty Questions and Answers About the Ozone Layer, question 17
Data
Energy flows: IPCC AR6 WGI Figure 7.2 (adapted there from Wild et al. 2015, 2019), global annual means at the start of the 21st century. Forcing and climate sensitivity: IPCC AR6 WGI, chapter 7 and the Summary for Policymakers. Carbon: Global Carbon Budget 2025 (Friedlingstein et al., Earth Syst. Sci. Data 18, 3211, 2026), the 2015–2024 means and 2024. Carbon dioxide: NOAA Global Monitoring Laboratory, global annual means. The emission temperature, the Planck curves, the shares below and above 4 µm and the lab’s forcing (a logarithm calibrated to AR6’s 3.93 W/m² for a doubling) are computed on this page. The apparatus follows J. Tyndall, Phil. Trans. R. Soc. 151 (1861), §4 and Plate I (C. Becker del., J. Basire sc.), with the front chamber and the rock-salt plates from Phil. Trans. 152 (1862); sizes the papers do not give are judged from the plate, and the tube is drawn shorter than its 4 feet. The column of air, its ground and sea, and the bands drawn on it are this page’s own model. Material presets, parts and the softbox studio of the site’s model kit are ported from AirsupHQ/machine-skill (MIT, © 2026 Air Supply Technologies Inc.).
The text, pictures and models on this page are licensed CC BY-NC 4.0: free to use and adapt for teaching and other non-commercial purposes, with credit to world.lapla.si. Third-party material listed above keeps its own licence.
Cite this plate
Laplace’s Mini World, Plate 70, “The Greenhouse Effect”, https://world.lapla.si/en/greenhouse/, CC BY-NC 4.0, updated 2026-10-31.
Follow the question
 Plate 20The Breathing PlanetA tree’s wood is made mostly from air. Every summer the northern forests breathe in together, and the whole atmosphere holds less carbon dioxide.
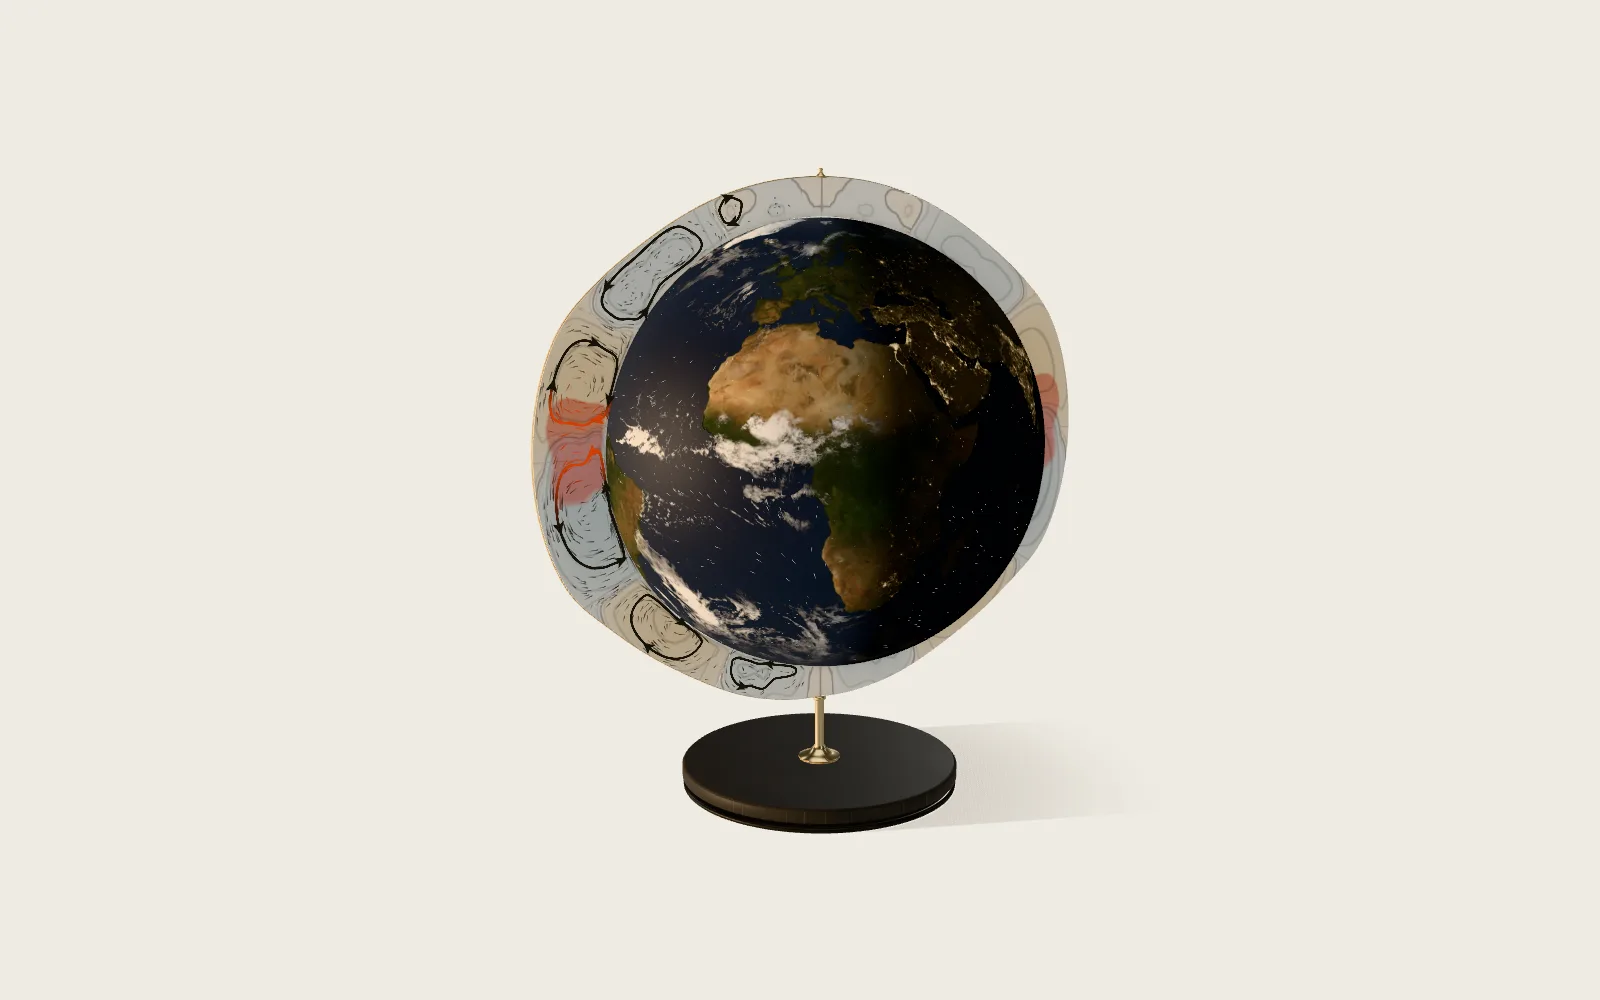 Plate 64The Atmosphere’s Three CellsThe Sun heats the equator most. Warm, moist air rises near the equator, building clouds and rain; aloft it flows toward the poles and sinks near 30° north and south, where skies are clear and dry and the ground is ruled by high pressure; then it flows back along the surface, turned into the trade winds by the spinning Earth. Averaged over many years and all longitudes, the air in each hemisphere goes round in three loops — the Hadley, Ferrel and polar cells — and the whole pattern shifts north and south with the seasons. The model is a globe in a ring of cut-open troposphere; the streamlines on the cut are computed from NCEP/NCAR mean winds, 1991–2020.