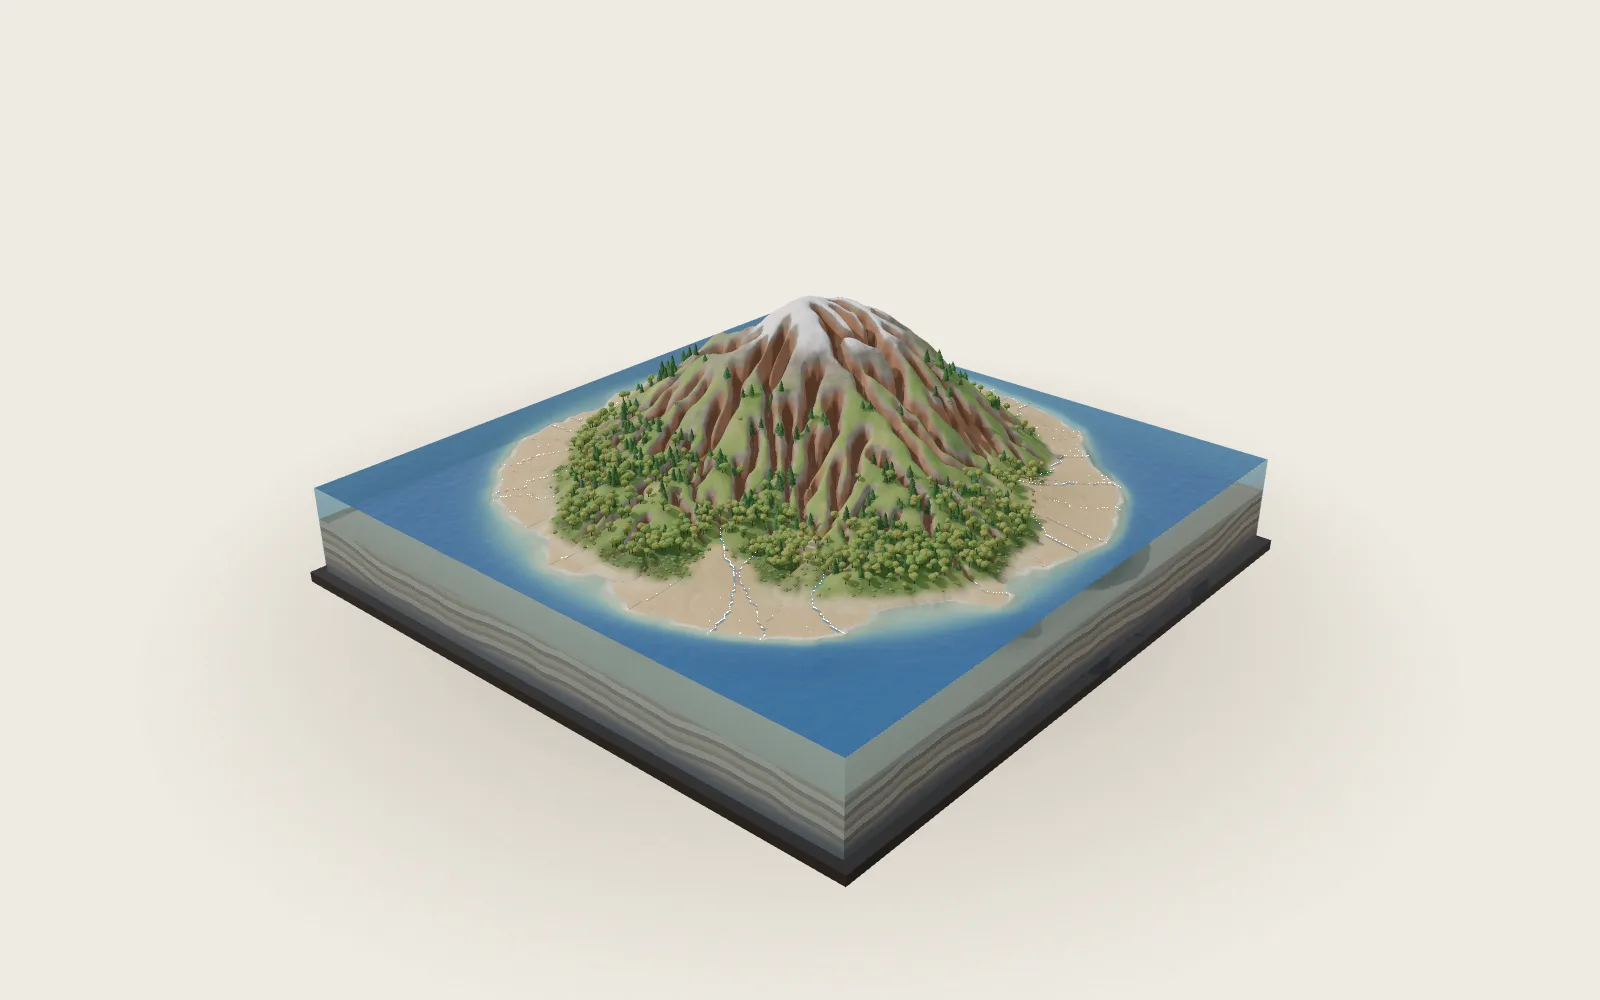
The Atmosphere’s Three Cells
The Sun heats the equator most. Warm air rises there, sinks near 30° and flows back. Earth’s spin splits each hemisphere’s flow into three cells.
Scroll
The Equator Gets the Most Sun
The farther from the equator, the more the sunlight slants, and the less of it each patch of ground receives. Worked out from Earth’s orbit, over a year each square metre at the top of the atmosphere gets about 416 W of sunlight at the equator and about 172 W at the poles, 2.4 times less.
The tropics absorb more sunlight than they lose as heat; the polar regions lose more than they absorb. Yet the tropics do not keep warming, nor the poles keep cooling: air and ocean carry the surplus poleward. Fasullo and Trenberth (2008) put the peak near 35° latitude at about 5.9 PW, 5.9 × 10¹⁵ joules a second, most of it in the air.
In this chapter the cut ring is coloured by mean temperature: warmest near the ground in the tropics, colder higher up and toward the poles.
Yearly mean sunlight: about 416 W/m² at the equator, 172 W/m² at the poles (from the orbit) · heat moves poleward, most near 35°, about 5.9 PW
Air Rises at the Equator
The trade winds of the two hemispheres meet near the equator. The air there is warm and moist; it rises, cools as it goes, and its water vapour condenses into towering storm clouds and heavy rain. This belt is the Intertropical Convergence Zone. With the air going up, the sea below is often calm: sailors call it the doldrums.
The orange strokes and arrows on the cut ring are that rising air: up to the tropopause, about 16 km high, then off toward the poles. The clouds on the globe are drawn only where it rains, after GPCP’s mean rainfall, 1991–2020.
The belt lies a few degrees north of the equator on average. Averaged round each latitude, the rainiest one is near 6.5°N. It sits north mainly because the Atlantic carries heat northward, leaving the Northern Hemisphere warmer (Schneider et al. 2014).
The trades meet, the air rises, clouds and rain · averaged round the globe, the rainiest latitude is near 6.5°N (GPCP, 1991–2020)
Sinking near 30°
High up, the air flows toward the poles, losing heat to space as it goes, and sinks near 30° north and south. Sinking air is squeezed, warms and dries out, so skies there are mostly clear and rain is scarce. The Sahara lies under it.
The sinking air builds high pressure at the surface. Averaged round the globe, sea-level pressure peaks near 35°N and 32.5°S at about 1,018 hPa. On a map it is not one ring but separate highs over the oceans, such as the Azores High in the North Atlantic. The white lines are isobars, every 4 hPa.
Sailors called these the horse latitudes: light winds, fair skies. Not every desert lies here: mountains’ lee sides, cold coastal currents (the Atacama, the Namib), distance from the sea and polar cold make deserts too.
Air sinks near 30°, warms and dries · at the surface, separate highs over the oceans · isobars every 4 hPa (NCEP/NCAR, 1991–2020)
The Trade Winds
At the surface the sinking air spreads out. The part flowing back toward the equator ought to blow straight at it. But Earth spins: seen from the turning ground, moving air veers right in the Northern Hemisphere, left in the Southern, and not at all on the equator. This is the Coriolis effect.
So the returning air becomes the northeast trades in the north and the southeast trades in the south. On the model the dashed line is the path on an Earth that did not spin, the solid one the path the air takes. In 1735 Hadley explained with Earth’s spin why the trades blow from the east.
The white streaks drift with the mean wind 10 m above the ground, 1991–2020, ten hours of wind each second. Averaged round the globe, the surface wind blows from the east everywhere from 31°N to 32°S.
Veering right in the north, left in the south · northeast and southeast trades · white streaks: the mean wind at 10 m (NCEP/NCAR, 1991–2020)
Three Cells
Averaged over many years and all longitudes, the air in each hemisphere goes round in roughly three loops. Nearest the equator is the Hadley cell, out to about 30°; in the middle the Ferrel cell, from 30° to past 60°; outermost the polar cell. The streamlines on the cut are computed from NCEP/NCAR mean winds, 1991–2020.
The three are very unequal. In these averages each Hadley cell turns over 78–96 billion kg of air a second; the southern Ferrel cell about 54 billion, the northern about 14 billion; the northern polar cell only about 2 billion.
In the Hadley and polar cells warm air rises and cold air sinks. The Ferrel cell runs the other way: it is what the mid-latitudes’ passing highs and lows look like on average, not a real convection loop. In 1735 Hadley pictured one great loop per hemisphere; in 1856 Ferrel added the mid-latitude one.
Hadley cell: 0° to about 30° · Ferrel cell: 30° to past 60° · polar cell · streamlines: averaged over longitude and years (NCEP/NCAR, 1991–2020)
Why Not One Big Loop
If Earth did not spin, warm air rising at the equator could flow all the way to the poles and sink there, one loop per hemisphere. That is what Hadley pictured.
Earth spins. Air leaving the equator aloft carries the eastward speed it had there; as it nears the axis it swings east and speeds up. If it kept all its angular momentum, by 30° it would be doing 134 m/s. The real atmosphere never gets there: in the 1991–2020 averages, the westerly 12 km up at 30°–35° is about 27–30 m/s, and about 44 m/s in the northern winter. That is the subtropical jet stream.
So the Hadley cell sinks around 30°. Beyond it, heat rides mostly on the mid-latitudes’ passing storms; averaged, those storms show up as the Ferrel cell.
Keeping its angular momentum to 30°: 134 m/s (computed) · in fact about 27–30 m/s at 12 km (NCEP/NCAR, yearly mean)
How High It Goes
All of this happens in the lowest layer of the air, the troposphere. It holds about three-quarters of the atmosphere’s mass and nearly all its weather. It gets colder with height, about 6.5 °C per kilometre on average.
Its top is the tropopause. In the NCEP/NCAR averages for 1991–2020 it stands about 16.5 km above the equator, 8.7 km above the North Pole and 9.5 km above the South Pole. The ring’s outer edge is the tropopause, its height drawn 120 times true.
The colour of the cut is the mean temperature. Over the equator it is about 25 °C near the ground and about −75 °C 16 km up. Above lies the stratosphere, which the ring leaves out.
Tropopause: about 16.5 km over the equator, about 9 km over the poles (NCEP/NCAR, 1991–2020) · the ring’s height drawn 120 times true
Westerlies and the Polar Front
The surface air flowing poleward from 30° is turned eastward into the westerlies. Averaged round the globe, the surface wind is westerly from 31°N to 64°N and from 32°S to 66°S. The southern belt is the strongest, about 7 m/s near 52°S, where it runs almost all the way round over open sea.
Near 60°, cold air flowing out from the poles meets the milder air of the mid-latitudes along the polar front. Most mid-latitude storms form along it, as Norwegian meteorologists worked out in the 1910s and 1920s. Poleward of it blow the polar easterlies; the polar cell is the weakest of the three.
High above 30° and 60° run jet streams, west to east, about 9–14 km up, strongest in winter.
Westerlies: about 30°–60° · polar front: near 60° · polar easterlies · white streaks: the mean wind at 10 m (NCEP/NCAR)
Following the Sun
The latitude where the Sun stands overhead swings between 23.4°N and 23.4°S through the year. The whole pattern follows, a month or two behind and not as far. Averaged round the globe, the rainiest latitude moves from about 8°S in January to about 9°N in August.
The winter hemisphere’s Hadley cell grows strong and reaches across the equator; the summer one nearly vanishes. In the NCEP/NCAR averages, January’s northern cell turns over about 200 billion kg of air a second and the southern one about 46 billion; in July it is the other way round.
Over the open oceans the rain belt moves only a few degrees. Over the Indian Ocean and South Asia it marches north to about 21°N in July and August, and the winds reverse with the season: the South Asian monsoon.
Sun overhead: 23.4°N to 23.4°S · the rain belt follows a month or two later · South Asia: the rain belt near 21°N in July–August (GPCP, 1991–2020)
Six Cells, Taken Apart
The ring is the troposphere cut along one meridian. Its near half is cut at the cells’ yearly-mean edges into six pieces: a Hadley, a Ferrel and a polar cell in each hemisphere. The globe stays where it is.
The piece under the pointer lifts out on its own, with its name.
Hadley cells · Ferrel cells · polar cells · the Earth
Twelve Months
These are the monthly means for 1991–2020, blended in a straight line from one month to the next. The streamlines on the ring, the cloud belt, the surface winds and the isobars all change with the month; the sunlight comes in at that month’s overhead latitude.
The readings are the latitude of the overhead Sun, the rainiest latitude averaged round the globe, and how much air the stronger of the two Hadley cells turns over each second.
Monthly means (NCEP/NCAR, GPCP, 1991–2020), not any one year · blended between months
Try thisMove the month from January to July: from which latitude to which does the rain belt move, and how far does the overhead Sun move?
What the model leaves out
The model is a globe in a ring of cut-open troposphere, not to scale: the ring’s height is drawn 120 times true and stops at the tropopause. The Earth is NASA’s Blue Marble (October 2004), with night lights from the 2016 Black Marble; the clouds come from NASA’s 2002 cloud map, kept only where GPCP’s mean rainfall is high, so the low clouds common over subtropical seas are not drawn. The streamlines on the cut are the mean meridional mass streamfunction, computed from NCEP/NCAR monthly mean north–south winds, 1991–2020: averaged round each latitude, leaving out air below the ground, with no net air crossing any latitude; lines are drawn at 2, 10, 40 and 120 billion kg a second, so strong cells have more lines than weak ones. The strokes’ speeds are compressed: the Hadley cells really move many times faster than the polar cells. The bold line with arrowheads in each cell is one of its streamlines; the arrows show which way the air turns. The cut is tinted by which way each cell turns (the chapters on heat and height show the mean temperature instead); the rising tropical air is the one orange-red. The white streaks on the ground are the mean wind 10 m up; the isobars are sea-level pressure and are left off ground above 1,500 m. The lab blends monthly means; it is not any year’s real weather.
Easy to get wrong
The three cells are what many years and all longitudes look like averaged; no single day’s sky shows three tidy loops, and the mid-latitudes are a procession of moving highs and lows. The subtropical high at the surface is not one ring but separate highs over the oceans. In the Ferrel cell warm air sinks and cold air rises; it is the storms’ average, not a convection loop. The 134 m/s is what angular momentum kept all the way would give, not a real wind. The Coriolis effect matters only over large distances: which way a sink drains depends on the basin’s shape and the water’s own motion, not the hemisphere. Not every desert lies under the sinking air. The rain belt sits a few degrees north of the equator on average, how many depends on how it is measured: about 6°N at the rainiest latitude, only about 2°N at the median of the rain. The IPCC’s latest assessment finds the Hadley circulation has likely widened since the 1980s, with medium confidence in how much.
Common questions · 5
- How much more sunlight does the equator get than the poles?
Worked out from Earth’s orbit, over a year each square metre at the top of the atmosphere gets about 416 W of sunlight at the equator and about 172 W at the poles, 2.4 times less.
01The Equator Gets the Most Sun ↑- What is the Intertropical Convergence Zone?
The trade winds of the two hemispheres meet near the equator. The air there is warm and moist; it rises, cools as it goes, and its water vapour condenses into towering storm clouds and heavy rain. This belt is the Intertropical Convergence Zone.
02Air Rises at the Equator ↑- Why are many deserts near 30° latitude?
High up, the air flows toward the poles, losing heat to space as it goes, and sinks near 30° north and south.
03Sinking near 30° ↑- How is the Ferrel cell different from the Hadley cell?
In the Hadley and polar cells warm air rises and cold air sinks. The Ferrel cell runs the other way: it is what the mid-latitudes’ passing highs and lows look like on average, not a real convection loop.
05Three Cells ↑- How does the rain belt move with the seasons?
The latitude where the Sun stands overhead swings between 23.4°N and 23.4°S through the year. The whole pattern follows, a month or two behind and not as far.
09Following the Sun ↑
Sources
- NASA Earth Observatory: Climate and Earth’s Energy Budget (the Sun heats the Earth unevenly; a surplus in the tropics, a deficit at the poles)
- NASA: Earth Fact Sheet (solar irradiance 1,361 W/m², obliquity 23.44°)
- J. T. Fasullo and K. E. Trenberth (2008): J. Climate 21, 2313 (poleward transport peaking at 5.9 PW near 35°)
- K. E. Trenberth and J. M. Caron (2001): J. Climate 14, 3433 (the atmosphere’s share at 35°: 78 % north, 92 % south)
- J. Marshall and R. A. Plumb: Atmosphere, Ocean and Climate Dynamics, chapter 8 notes (the Hadley cell, the trades, subtropical sinking, a non-rotating Earth, angular momentum)
- E. Halley (1686): An historical account of the trade winds, and monsoons…, Phil. Trans. 16, 153
- G. Hadley (1735): Concerning the cause of the general trade-winds, Phil. Trans. 39, 58
- A. O. Persson (2006): Hadley’s Principle, History of Meteorology 3, 17
- T. Schneider (2006): The general circulation of the atmosphere, Annu. Rev. Earth Planet. Sci. 34, 655 (the eddy-driven Ferrel cell; means and seasons)
- W. Ferrel (1856): An Essay on the Winds and the Currents of the Ocean (1882 reprint)
- NOAA JetStream: Global Atmospheric Circulations (three cells, a non-rotating Earth, Hadley in 1735)
- NOAA JetStream: The Jet Stream (where and how high the jets run; strongest in winter)
- NOAA JetStream: The Intertropical Convergence Zone (it follows the Sun)
- NOAA JetStream: Norwegian Cyclone Model (the Norwegian school of the 1910s and 1920s)
- NOAA Ocean Service: What are the doldrums? (rising air, light winds)
- NOAA Ocean Service: What are the horse latitudes? (high pressure near 30°, sunny and dry)
- NOAA Ocean Service, Currents tutorial: The Coriolis Effect (right in the north, left in the south)
- T. Schneider, T. Bischoff and G. H. Haug (2014): Nature 513, 45 (the ITCZ near 6°N on average, why it lies north, its swing over the oceans and the Indian Ocean)
- A. Donohoe et al. (2013): J. Climate 26, 3597 (the rain belt’s seasonal swing and lag)
- M. Dima and J. M. Wallace (2003): J. Atmos. Sci. 60, 1522 (the Hadley cell’s seasons: the winter cell dominates)
- P. H. Stone: MIT 12.812 notes, section 3 (the three-cell structure; the Ferrel cell is thermally indirect; the very weak polar cell)
- M. J. Rodwell and B. J. Hoskins (2001): J. Climate 14, 3192 (subtropical highs over the oceans)
- M. S. Reboita et al. (2019): Frontiers in Earth Science 7 (the Southern Hemisphere’s three subtropical highs)
- USGS: Deserts: Geology and Resources, Types of Deserts (trade-wind, rain-shadow, coastal and polar deserts)
- Scientific American (2001): Does water flowing down a drain spin differently depending on the hemisphere?
- UCAR Center for Science Education: The Troposphere (75–80 % of the atmosphere’s mass)
- NASA Glenn Research Center: Earth Atmosphere Model (about 6.5 °C per km in the standard atmosphere)
- S. Fueglistaler et al. (2009): Rev. Geophys. 47, RG1004 (the tropical tropopause near 17 km)
- K. P. Hoinka (1998): Mon. Wea. Rev. 126, 3303 (the tropopause’s pressure over the poles)
- D. M. Schultz et al. (2019): Meteorological Monographs 59 (the polar front and extratropical cyclones; Bjerknes and Solberg 1922)
- US National Weather Service glossary: Monsoon (a wind that reverses with the seasons)
- US National Weather Service glossary: Subtropical Jet (20°–30°, 12–14 km)
- IPCC (2021): AR6 Working Group I, Chapter 2 (the Hadley circulation has likely widened since the 1980s)
- NCEP/NCAR Reanalysis (Kalnay et al. 1996), via NOAA PSL: this page’s winds, temperatures, heights, pressures and tropopause
- E. Kalnay et al. (1996): The NCEP/NCAR 40-Year Reanalysis Project, BAMS 77, 437
- GPCP monthly precipitation v2.3, via NOAA PSL: this page’s rainfall and cloud belt
- R. F. Adler et al. (2018): Atmosphere 9, 138 (GPCP v2.3)
- NOAA Interpolated OLR, via NOAA PSL: the infrared going out to space
- NASA Earth Observatory: Blue Marble: Next Generation (Stöckli et al. 2005)
Data
Winds, temperatures, heights, sea-level, surface and tropopause pressure: NCEP/NCAR Reanalysis 1, 1991–2020 monthly long-term means (Kalnay et al. 1996); precipitation: GPCP v2.3 (Adler et al. 2018); outgoing longwave radiation: NOAA Interpolated OLR. Data provided by the NOAA PSL, Boulder, Colorado, USA, from their website at https://psl.noaa.gov. Earth: NASA Earth Observatory, Blue Marble: Next Generation, October 2004 (Reto Stöckli et al. 2005); city lights, NASA Earth Observatory Black Marble 2016 (Joshua Stevens, Miguel Román, Suomi NPP VIIRS); clouds, NASA Blue Marble 2002 (Reto Stöckli, NASA GSFC). Elevation: ETOPO1, NOAA; GMTED2010 and SRTM, USGS (Terrain Tiles on AWS Open Data). The globe’s ring, its height scale, the drawn flow and the lab’s month-to-month blending are this page’s own model, not any institution’s product.
The text, pictures and models on this page are licensed CC BY-NC 4.0: free to use and adapt for teaching and other non-commercial purposes, with credit to world.lapla.si. Third-party material listed above keeps its own licence.
Cite this plate
Laplace’s Mini World, Plate 64, “The Atmosphere’s Three Cells”, https://world.lapla.si/en/circulation/, CC BY-NC 4.0, updated 2026-10-30.
Follow the question
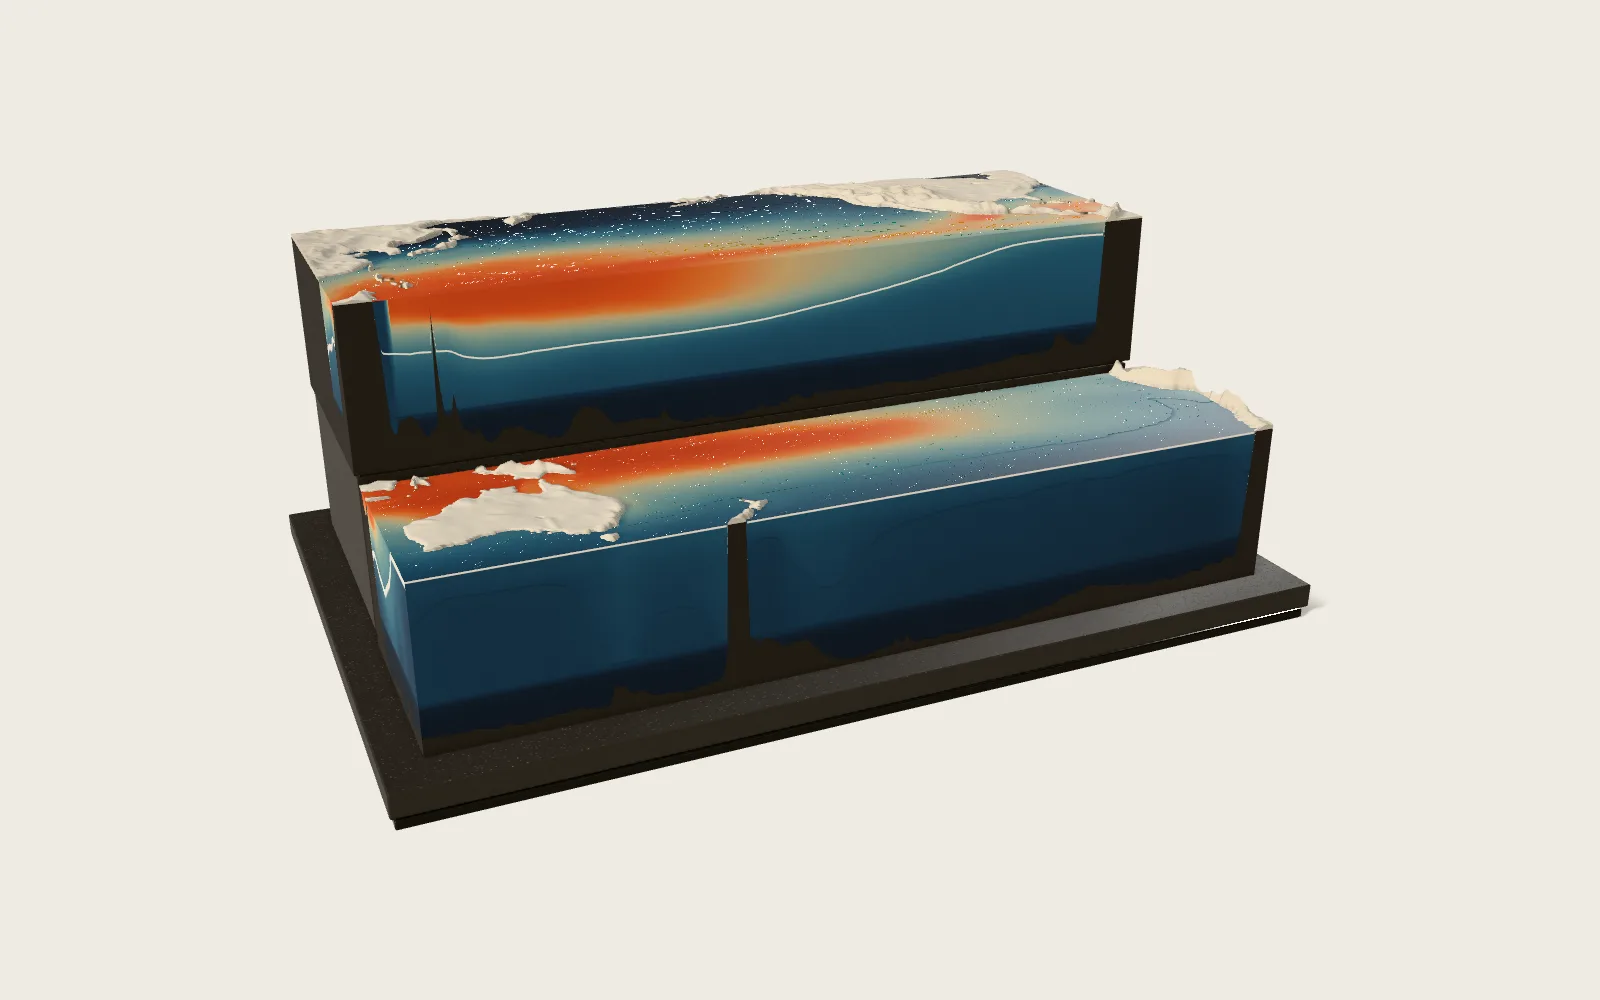 Plate 56Ocean Currents and El NiñoThe wind pushes the sea, the turning Earth deflects the flow, the continents stand in its way, and the surface water of each ocean goes round in great gyres, fast and narrow on their western sides. Across the tropical Pacific the trade winds pile warm water up in the west, and cold water lies close to the surface in the east. Every two to seven years the trades weaken, the warm water surges east and the thermocline flattens: El Niño, and weather far away often shifts with it. The model is a block of the Pacific cut along the equator, its water coloured by measured temperature.
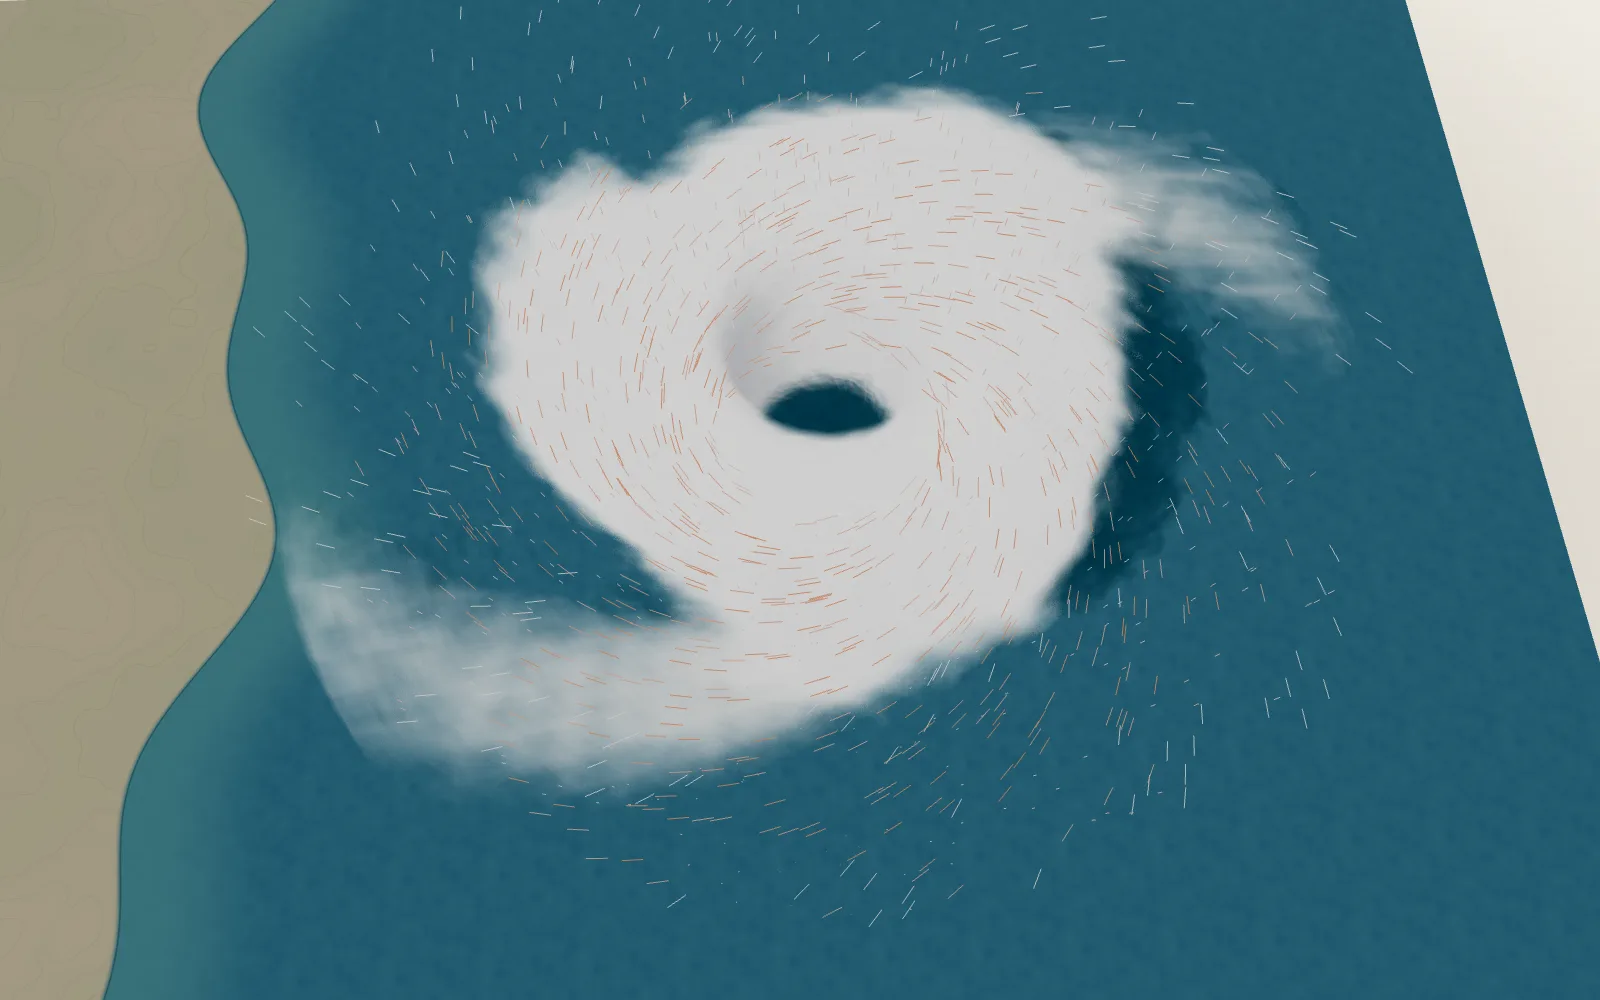 Plate 04The Engine of a HurricaneIt runs on warm water, and the turning Earth sets it spinning.