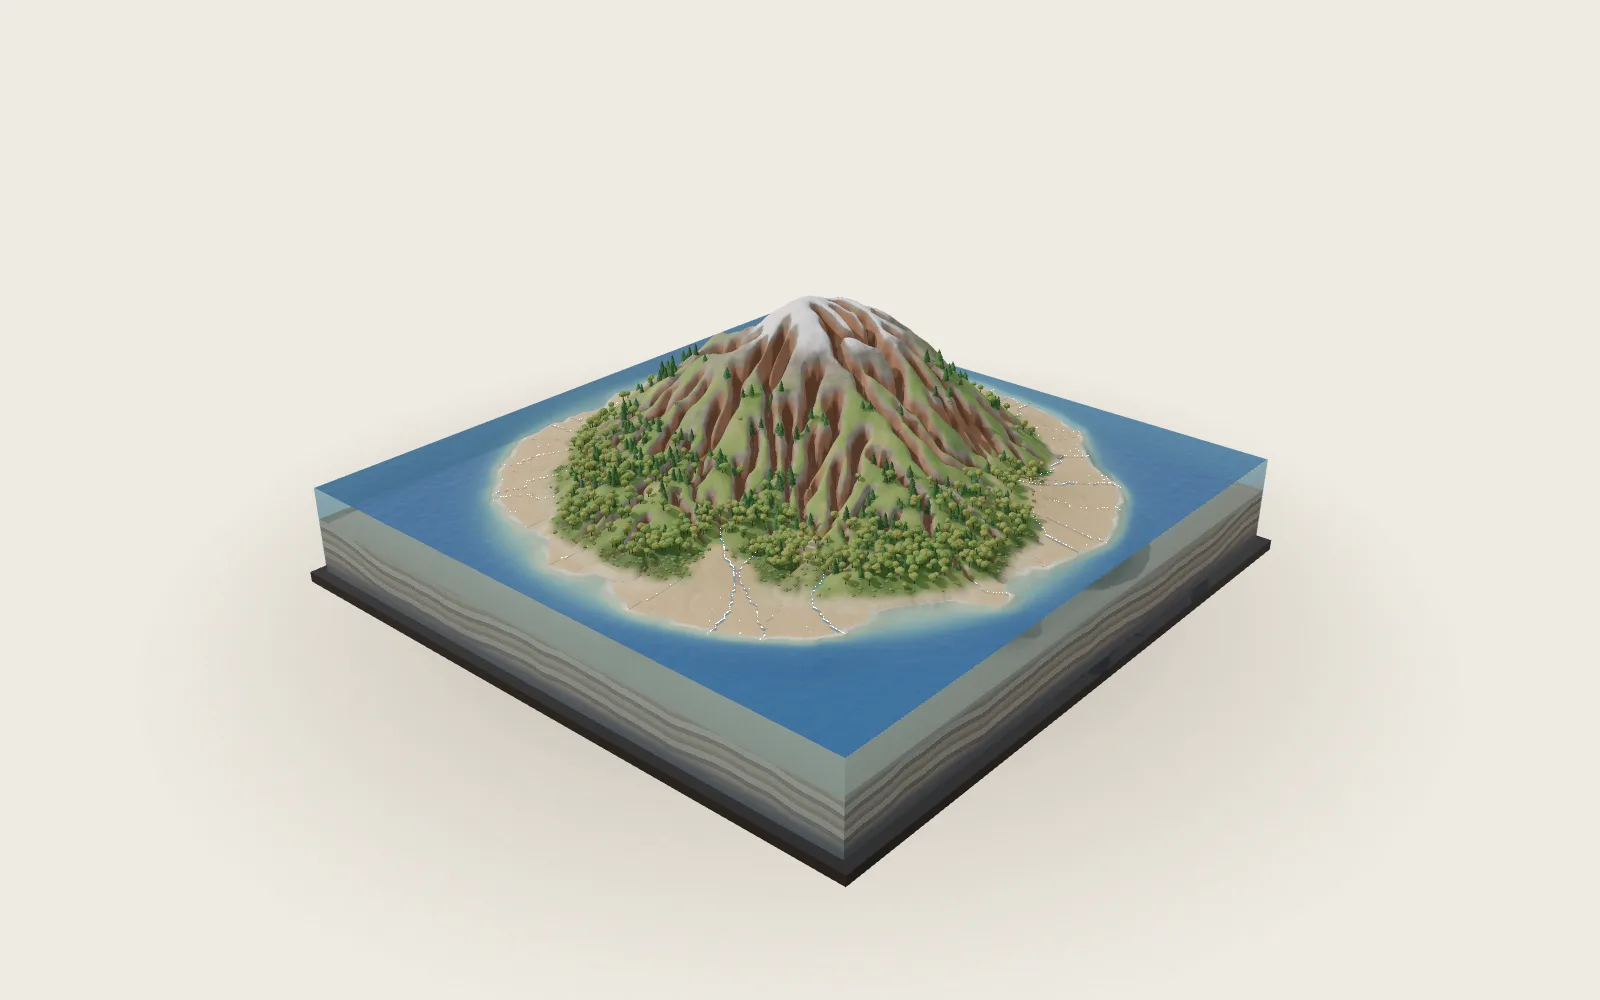
Ocean Currents and El Niño
Wind pushes the sea; the turning Earth bends the flow into great gyres. Every few years the Pacific’s trade winds weaken, warm water surges east, and weather far away shifts.
Chapters · 13
Scroll
The Wind Pushes the Sea
Over the tropical sea the wind blows from the east most of the year: the trade winds. In the middle latitudes the westerlies blow. The wind drags the surface water along, and that is mostly what drives the ocean’s surface currents. NOAA puts the water moved by the wind in the top 100 m or so.
The white streaks on the model are the surface current: each drifts with the mean current at 5 m in GODAS, 2011–2020, at 25 days a second. Most open-ocean water moves only a few centimetres a second, a few kilometres a day.
Currents aren’t rivers with banks. The sea is full of eddies, and water keeps moving in and out. The tracks of the world’s drifting buoys, about 1,300 in 2022, each with a drogue at 15 m, wander and loop.
Trade winds in the tropics, westerlies in the middle latitudes · the wind moves the top 100 m or so · white streaks: the mean current at 5 m, 2011–2020 (GODAS)
Turned to the Right
From 1893 to 1896 Fridtjof Nansen’s Fram drifted with the Arctic ice. He noticed that the ice didn’t follow the wind: it drifted 20°–40° to the right of it.
Ekman explained it in his paper of 1905. The Earth turns, so moving water is deflected to the right in the Northern Hemisphere and to the left in the Southern. Each layer drags the one below, slower and more turned the deeper it is; added up over the top 100 m or so, the water moves at 90° to the wind.
In the North Pacific the trades to the south push water north and the westerlies to the north push it south, so it piles up in between: the sea surface in the middle of the gyre stands about 1 m higher than at its edges. Water runs downhill, is turned by the Earth’s rotation, and ends up circling the hill. The model exaggerates the sea surface’s rise and fall.
Ice drifts 20°–40° right of the wind (Nansen) · the net transport is at 90° to the wind · the gyre’s centre stands about 1 m high
Five Great Gyres
The wind, the Earth’s rotation and the continents in the way turn the surface water of each ocean into great loops: gyres. NOAA counts five major subtropical gyres, one each in the North and South Pacific, the North and South Atlantic, and the Indian Ocean.
Gyres turn clockwise in the Northern Hemisphere and anticlockwise in the Southern. In the North Pacific the Kuroshio runs north past Japan, the North Pacific Current east, the California Current south along North America, and the North Equatorial Current west again.
The South Pacific’s gyre runs the other way: the South Equatorial Current west, the East Australian Current south, the Humboldt Current north along South America. There are no gyres on the equator, where there is no Coriolis effect.
Five subtropical gyres · clockwise in the north, anticlockwise in the south · white streaks: the mean current in GODAS
Narrow and Fast in the West
On a gyre’s western side the water is squeezed into a narrow, fast current about 100 km wide, flowing at about 1 m/s; the Kuroshio reaches over 2 m/s. The return flow in the east is broad and slow: the California Current generally moves only 5–10 cm/s.
Flows are counted in sverdrups (Sv): 1 Sv is a million cubic metres a second. Where the Gulf Stream passes the Florida Straits (there it is called the Florida Current) it carries about 32 Sv on average; all the world’s rivers together bring about 1.2 Sv to the sea. The Kuroshio carries about 24 Sv in the East China Sea; near 60°W the Gulf Stream, with the water circling back on either side, carries about 150 Sv.
Why in the west? In 1948 Henry Stommel worked it out: the key is that the Coriolis effect changes with latitude. Were it the same everywhere, a gyre would be symmetric; because it grows towards the pole, the return flow is pressed against the western side of the ocean.
Western boundary currents: about 100 km wide, about 1 m/s · the Gulf Stream (Florida Straits) about 32 Sv · all the world’s rivers about 1.2 Sv
Cold Water from Below
Off Peru and Chile the wind blows along the coast towards the equator. In the Southern Hemisphere the water is turned to the left of the wind, so the surface water is pushed away from the shore and colder water from a hundred or two hundred metres down rises to take its place.
The rising water is cold and carries nutrients, so plankton grow and fish follow. The same happens off California, northwest Africa and southwest Africa. These eastern boundary upwelling regions cover under 1 % of the ocean but give up to a fifth of the world’s sea catch.
The Peruvian anchoveta is the world’s largest wild catch: about 5 million tonnes in 2024. In 1970, 13.1 million tonnes were caught; after the El Niño of 1972–73 and heavy fishing, the 1973 catch was only about 1.8 million.
The wind blows along the coast towards the equator · the surface water is pushed offshore · cold water rises from a hundred or two hundred metres
The Slow Circulation Below
The wind drives only the upper ocean. Below, the water overturns slowly, through differences in density set by temperature and salt: in the far North Atlantic and around Antarctica cold, salty water sinks, then spreads slowly through the oceans and rises again.
Deep currents move only a few centimetres a second. NOAA estimates that a cubic metre of water takes about 1,000 years to travel the whole global “conveyor belt”. The front block’s cut is at 45°S; below 1,000 m it is almost all colder than 4 °C.
The Atlantic’s part of the overturning is the AMOC. The RAPID array has measured it at 26.5°N without a break since April 2004: about 17 Sv on average, weakening by about 1 Sv a decade over 2004–2023 (between 0.4 and 1.6 Sv), but the record is still too short to tell natural swings from human influence. The IPCC (2021) finds it very likely to weaken over the 21st century, with medium confidence that it will not collapse abruptly before 2100.
Deep currents: a few centimetres a second · about 1,000 years round (NOAA’s estimate) · the AMOC at 26.5°N: about 17 Sv (RAPID)
Thick in the West, Thin in the East
In ordinary years the trade winds blow along the equator from South America towards Asia and push the warm surface water into the western Pacific: the sea surface is about half a metre higher at Indonesia than at Ecuador, and the sea about 8 °C warmer in the west than in the east. The great body of water above about 28 °C is the warm pool.
The cut shows it best. The 20 °C isotherm is often taken as the thermocline, where the temperature falls fastest. In the December mean of 1991–2020 in GODAS it lies about 180 m deep at 140°E and only about 33 m deep at 100°W. In the east the cold water lies close to the surface; it replaces the surface water the wind drives apart at the equator, and a cold tongue shows on the sea.
The air follows the sea: it rises over the warm pool and rains, sinks dry over the cold water in the east, and flows back from west to east aloft, one great loop. Jacob Bjerknes named it the Walker circulation in 1969, after Gilbert Walker.
Sea level about half a metre higher at Indonesia than at Ecuador · the west about 8 °C warmer · the 20 °C isotherm: about 180 m at 140°E, about 33 m at 100°W (GODAS)
El Niño
Every few years the trade winds weaken over the central and western Pacific, sometimes even turning westerly for a few weeks. The warm water piled up in the west starts to surge east in equatorial Kelvin waves, which cross the Pacific in two to three months and push the thermocline down as they go.
With a deeper thermocline in the east, the water welling up is no longer cold; the eastern Pacific warms, the rain follows the warm water east, and the trades weaken further. Wind and sea drive each other on: in 1969 Bjerknes called it a chain reaction. The cut shows December 1997: the 20 °C isotherm lies between 85 and 150 m along the whole equator, about 100 m deeper than usual in the east, with the sea above 28 °C.
The name comes from South American fishermen, who called a warm current that appeared along the coast around Christmas El Niño, the Christ child. Later the word came to mean only the strong warmings that come every few years. One usually lasts 9–12 months, and they come every two to seven years on average, with no fixed rhythm.
The trades weaken · warm water moves east and the thermocline flattens · December 1997: the 20 °C isotherm about 100 m deeper than usual in the east (GODAS)
La Niña
The other way round: when the trades blow harder than usual, more warm water piles up in the west, the thermocline in the east rises and more cold water wells up. This is La Niña.
The cut shows December 1988: the 20 °C isotherm about 190 m deep in the west; near 120°W water colder than 20 °C reaches the surface, and the sea there is only about 20 °C.
In La Niña more rain falls over the western Pacific. An El Niño usually lasts about a year; a La Niña can last one to three years.
The trades blow harder · a steeper thermocline · December 1988: cold water at the surface near 120°W (GODAS)
What Counts as One
NOAA watches a rectangle of the central and eastern equatorial Pacific: the Niño 3.4 region, 5°N–5°S, 170°W–120°W.
Since 1 February 2026 NOAA’s official classification uses the Relative Oceanic Niño Index (RONI): the region’s three-month mean sea-surface temperature anomaly minus the mean anomaly of the whole tropics (20°N–20°S). Five overlapping three-month seasons in a row at +0.5 °C or more make an El Niño; at −0.5 °C or less, a La Niña.
The chart shows the RONI since 1950. The events of 1982–83, 1997–98 and 2015–16 are among the strongest on record. For July–September 2026 the RONI is +1.69 °C; on the older Oceanic Niño Index (ONI) it is +2.16 °C.
Niño 3.4: 5°N–5°S, 170°W–120°W · official index: the RONI (from February 2026) · five overlapping seasons beyond ±0.5 °C
Weather Far Away
El Niño isn’t a storm: it is a state of the tropical Pacific that lasts for months. The sea’s temperature changes, the circulation of the air changes with it, and weather far away is affected.
The effects are tendencies, not certainties. In an El Niño winter Indonesia and Australia tend to be dry, coastal Peru tends to get heavy rain and floods, and the southern United States tends to be cooler and wetter; Atlantic hurricanes tend to be fewer, eastern and central Pacific ones more. In NOAA’s words, typical means common but not guaranteed, because each event is unique.
It also nudges the global mean temperature up: NASA estimates that the El Niño added about 0.12 °C to 2016’s global temperature anomaly. In 1997–98 drought let Indonesia’s forest fires burn out of control. The global coral bleaching of 1998 came during a strong El Niño; the one of 2014–2017 was prolonged by the El Niño of 2015–16, with global warming behind it.
Tendencies, not certainties · 2016: about 0.12 °C added to the global temperature anomaly by El Niño (NASA)
Lifted Off, Layer by Layer
The model’s water is in three layers by temperature: water above 20 °C, water of 20–10 °C, and water below 10 °C; under them, the sea floor and the land.
The warm water is a thin layer, mostly in the tropics; towards the poles the layers beneath come up to the surface one by one. With all the water lifted off, the basin’s own shape shows. The layer under the pointer lifts out alone and is named.
Above 20 °C · 20–10 °C · below 10 °C · the sea floor and the land
Stronger or Weaker Trades
This is a toy model: one warm layer floating on still cold water, along the equator from 130°E to 80°W. The wind’s push is held by the layer’s east–west slope, and the amount of warm water stays the same. Its numbers come from the data: a warm layer 124 m thick on average and a density difference of 2.6 kg/m³ between the layers (GODAS), and a usual wind stress of 0.025 N/m².
The readings are the steady state: the depth of the 20 °C isotherm at the west and east ends, how much higher the sea stands in the west, and the change of the sea temperature at the east end (from how December SST follows the isotherm’s depth in GODAS). The real ocean takes months to adjust: a Kelvin wave needs two to three months to cross the Pacific.
A toy model: one warm layer, the wind stress held by the thermocline’s slope · usual = 100 %
Try thisSet the trade winds to half their usual strength: how deep is the 20 °C isotherm in the west and in the east?
What the Model Leaves Out
The model is a block of the Pacific, not to scale: 1° is 5 mm across; depth is stretched hard, the top 300 m taking 68 % of the block’s thickness and 300–6,000 m the rest; heights on land are exaggerated separately. The water is coloured by December temperatures from GODAS, the NOAA/NCEP ocean data assimilation system: the surface at 5 m, the cuts by the section there; the three layers are split at the 20 °C and 10 °C isotherms. The white streaks drift with the mean current at 5 m over 2011–2020: averaging removes the eddies, so real paths are far more tangled, and the 1° grid draws narrow currents such as the Kuroshio too broad and too slow. The wind arrows are NCEP/NCAR Reanalysis means for 1991–2020; the Walker loop is a drawing. The lab is a two-layer toy that leaves out the waves and shows only the steady state. Its usual wind stress, 0.025 N/m², is the value that matches the measured December tilt of the thermocline and lies within the 0.025–0.055 N/m² measured at 110°W–140°W; reanalysis winds with a common drag coefficient give only about 0.015 averaged over the basin. The toy raises the western sea level by about 35 cm, less than the measured half metre, because the real ocean has more than two layers. Away from the equator the toy’s change is faded out by latitude by hand, not computed.
Easily Misread
Currents aren’t rivers with banks: the sea is full of eddies, water keeps moving in and out, and a mean current is an average over many years. The Coriolis effect turns water to the right in the Northern Hemisphere, but western boundary currents are narrow and fast because that effect changes with latitude, not because the Earth spinning eastward throws water to the west. El Niño is not a storm but a state of ocean and air lasting months; it makes some weather more likely and guarantees no particular rain or drought. The anchoveta collapse of 1973 came from El Niño and heavy fishing together. The AMOC is weakening, but 20 years of records can’t yet separate natural swings from human influence, and it is not “collapsing”. Rankings depend on the index: on the RONI 1982–83 is the strongest event, on the older ONI 2015–16 is the highest.
Common questions · 5
- Why do currents turn right in the Northern Hemisphere?
Ekman explained it in his paper of 1905.
02Turned to the Right ↑- Why are the Kuroshio and the Gulf Stream narrow and fast?
Why in the west? In 1948 Henry Stommel worked it out: the key is that the Coriolis effect changes with latitude.
04Narrow and Fast in the West ↑- Where does the cold water off Peru come from?
Off Peru and Chile the wind blows along the coast towards the equator.
05Cold Water from Below ↑- How does an El Niño start?
Every few years the trade winds weaken over the central and western Pacific, sometimes even turning westerly for a few weeks.
08El Niño ↑- How does NOAA decide that an El Niño is under way?
Since 1 February 2026 NOAA’s official classification uses the Relative Oceanic Niño Index (RONI): the region’s three-month mean sea-surface temperature anomaly minus the mean anomaly of the whole tropics (20°N–20°S).
10What Counts as One ↑
Sources
- NOAA PMEL: What is El Niño? (the half-metre sea-level difference and 8 °C SST difference of normal years, the thermocline; its flattening and the rain moving east in El Niño)
- NOAA Ocean Service, Currents tutorial: surface currents driven by the winds in the upper 100 m; the Coriolis effect; strong, narrow western and weak, broad eastern boundary currents
- NOAA Ocean Service: Boundary Currents (gyres clockwise in the north, anticlockwise in the south, none on the equator)
- NOAA Ocean Service: What is a gyre? (the five major subtropical gyres)
- NOAA Ocean Service: Thermohaline Circulation (deep currents of a few centimetres a second; the estimate of about 1,000 years)
- NOAA Ocean Service: What is upwelling?
- NOAA Ocean Service: What are El Niño and La Niña? (9–12 months, every 2–7 years, the fishermen and Christmas)
- NOAA PSL: El Niño Southern Oscillation (La Niña lasting 1–3 years)
- NOAA CPC: the Relative Oceanic Niño Index (RONI), table and notes
- US National Weather Service, Public Information Statement 26-05 (13 January 2026): RONI from 1 February 2026
- NOAA CPC: the Oceanic Niño Index (ONI, ERSST v6)
- NOAA Climate.gov: El Niño and La Niña: Frequently asked questions (not a storm; typical is not guaranteed; hurricanes; global temperature)
- NOAA Climate.gov ENSO blog (2014): The Walker Circulation: ENSO’s atmospheric buddy
- NOAA Climate.gov ENSO blog (2015): Oceanic Kelvin waves (two to three months across the Pacific)
- R. H. Stewart (2008): Introduction to Physical Oceanography (Nansen’s ice drift, Ekman transport, Stommel’s westward intensification, the equatorial Pacific, Kelvin waves)
- Woods Hole Oceanographic Institution: Nansen and the Drift of the Fram (1893–1896)
- W. Jenkins and J. Bye (2006): Polar Record 42 (Ekman’s paper of 1905)
- American Meteorological Society, DataStreme Ocean (via Ocean Motion): the gyre’s sea surface up to 1 m high, geostrophic flow; eastern boundary currents slower, shallower, wider
- S. Imawaki et al. (2013): Western Boundary Currents, in Ocean Circulation and Climate, 2nd ed. (widths, speeds, transports; the Florida Current, the Gulf Stream, the Kuroshio)
- D. L. Volkov et al. (2024): Nature Communications 15, 7780 (the Florida Current cable record, the AMOC)
- Japan Meteorological Agency: the Kuroshio (over 2 m/s)
- A. Dai and K. E. Trenberth (2002): global river discharge about 37,288 km³ a year (about 1.2 Sv)
- H. Stommel (1948): The westward intensification of wind-driven ocean currents, Trans. AGU 29, 202
- NOAA Monterey Bay National Marine Sanctuary: the California Current, generally 5–10 cm/s
- M. García-Reyes et al. (2015): Frontiers in Marine Science 2, 109 (eastern boundary upwelling systems under 1 % of the ocean, up to 20 % of the catch, after Pauly & Christensen 1995)
- FAO (2026): The State of World Fisheries and Aquaculture 2026 (anchoveta, 5.0 Mt in 2024, 13.1 Mt in 1970)
- FAO (2005): Fisheries Technical Paper 457 (the 1972–73 collapse: fishing and El Niño)
- B. Keith (1974): Fisheries of Peru, 1972-73, NOAA NMFS (1.8 Mt in 1973)
- D. A. Smeed et al. (2018): Geophysical Research Letters 45, 1527 (RAPID, measuring at 26.5°N since April 2004)
- G. D. McCarthy et al. (2025): Geophysical Research Letters (weakening of about 1.0 Sv a decade, 2004–2023)
- IPCC (2021): AR6 Working Group I, Summary for Policymakers, C.3.4
- University of Hawaiʻi, OCN 201: the thermocline from 150–200 m in the west to 30–50 m in the east
- J. Bjerknes (1969): Atmospheric teleconnections from the equatorial Pacific, Monthly Weather Review 97, 163 (the Walker circulation, the chain reaction)
- M. J. McPhaden (1999): Genesis and evolution of the 1997–98 El Niño, Science 283, 950
- M. J. McPhaden and B. A. Taft (1988): J. Phys. Oceanogr. 18, 1713 (wind stress balanced by the zonal pressure gradient; the stress at 110°W and 140°W)
- NASA (2017): NASA, NOAA Data Show 2016 Warmest Year on Record Globally (about 0.12 °C from El Niño)
- NASA Earth Observatory: El Niño Linked to Record Air Pollution (Indonesia’s fires of 1997–98)
- NOAA Coral Reef Watch: the global coral bleaching events (1998, 2010, 2014–2017)
- WMO–IOC Data Buoy Cooperation Panel (2022): Global Drifter Program report (about 1,300 drifters)
- GODAS (the NOAA/NCEP Global Ocean Data Assimilation System), via NOAA PSL: this page’s temperatures, currents and sea level
- NCEP/NCAR Reanalysis, via NOAA PSL: the 10 m winds, 1991–2020 means
Data
Ocean temperature, currents and sea level: GODAS, the NOAA/NCEP Global Ocean Data Assimilation System (D. W. Behringer and Y. Xue, 2004); winds: NCEP/NCAR Reanalysis long-term means 1991–2020; the Relative Oceanic Niño Index and the Oceanic Niño Index: NOAA Climate Prediction Center (ERSST v6). GODAS and NCEP/NCAR data provided by the NOAA PSL, Boulder, Colorado, USA, from their website at https://psl.noaa.gov. Elevation and seafloor: ETOPO1, NOAA; GMTED2010 and SRTM, USGS (Terrain Tiles on AWS Open Data). Seawater density from the UNESCO (1981) equation of state. The block, its depth scale, the Walker loop and the lab’s two-layer model are this page’s own model of the principle, not any institution’s product.
The text, pictures and models on this page are licensed CC BY-NC 4.0: free to use and adapt for teaching and other non-commercial purposes, with credit to world.lapla.si. Third-party material listed above keeps its own licence.
Cite this plate
Laplace’s Mini World, Plate 56, “Ocean Currents and El Niño”, https://world.lapla.si/en/currents/, CC BY-NC 4.0, updated 2026-10-29.
Follow the question
 Plate 04The Engine of a HurricaneIt runs on warm water, and the turning Earth sets it spinning.
 Plate 10How the Moon Moves the SeaWhy are there two high tides a day? Because the Moon pulls the near ocean toward it — and leaves the far ocean behind.