Plate 20 · Life
The Breathing Planet
Most of a tree’s wood comes not from the soil but from the air. Every summer, countless leaves across the north breathe in together — and even the air high on a Hawaiian volcano changes.
Scroll
A Leaf Is a Factory
A leaf takes in carbon dioxide from the air and water from the roots, and with energy from sunlight turns them into sugar, giving off oxygen as it goes. This is photosynthesis.
Sugar is the plant’s food and its building material: leaves, trunk and roots are all built up from it, bit by bit.
Grey: carbon dioxide · white: oxygen
Trees Are Made of Air
Almost four hundred years ago, the Flemish scientist Jan Baptist van Helmont planted a willow in a weighed pot of soil. Five years later the willow had gained more than 70 kilograms; the soil had lost less than 60 grams.
Where did all that weight come from? He thought it came from the water he poured on. In fact about half of dry wood is carbon, and every bit of that carbon came from carbon dioxide in the air.
One Deep Breath a Year
Since 1958, scientists have measured carbon dioxide in the air on Mauna Loa in Hawaii almost without a break. Each year the curve rises and falls once: highest in May, lowest in September and October.
In spring and summer, forests and grasslands across the north leaf out, and photosynthesis takes in more carbon dioxide than plants and soil give off, so the air holds less. In autumn and winter, leaves fall and rot, and the carbon dioxide goes back into the air.
Carbon dioxide at Mauna Loa · the last five years · NOAA
The North Breathes Harder
Most of Earth’s land is in the Northern Hemisphere, so that is where the breathing shows most. At Utqiaġvik, at the top of Alaska, the yearly swing is about three times Hawaii’s; at the South Pole, it hardly shows at all.
The Southern Hemisphere has much less land, so its seasons do much less to the air.
Seasonal swing at three stations · average of 2015 to 2024
Beyond the Breathing
Underneath the yearly swing, the curve keeps climbing: from about 316 ppm in 1958 to more than 420 ppm now. “Ppm” stands for parts per million: how many carbon dioxide molecules there are in every million molecules of air.
The rise comes mainly from burning coal, oil and gas. Each year, plants and the ocean take up roughly half of the carbon dioxide people release; the rest stays in the air. In the 1960s it rose by less than 1 ppm a year; now it rises by about 2.5.
Carbon dioxide at Mauna Loa · 1958 to now · NOAA
Your Turn
Drag the days and take the tree through a year: watch when the leaves take carbon dioxide in, and when it goes back into the air. At top right is Mauna Loa’s average swing for that month.
Try thisDrag through the year: in which month is Mauna Loa’s carbon dioxide highest?
What the model leaves out
The carbon dioxide and oxygen in the picture are schematic; real molecules are far too small to see. Plants also breathe out a little carbon dioxide, day and night; the seasonal change is what is left after breathing in and out are added up. The seasonal curves are averages over 2015 to 2024; any single year differs a little.
A common misreading
Plants don’t grow by eating soil. Soil gives them water and small amounts of minerals, but most of a plant’s body is built from carbon dioxide from the air, and water. And the curve dipping each summer does not mean the carbon dioxide problem is fixing itself: every year’s low point is higher than the last.
Sources
- NOAA Global Monitoring Laboratory: Trends in atmospheric carbon dioxide
- Scripps Institution of Oceanography: The Keeling Curve
- NOAA: Global monthly mean CO₂ and its seasonal cycle
- NASA Earth Observatory: The carbon cycle
- Global Carbon Budget
Data
Carbon dioxide: NOAA Global Monitoring Laboratory (Mauna Loa, Utqiaġvik, South Pole); Mauna Loa record begun by C. D. Keeling, Scripps Institution of Oceanography. Elevation and seafloor (globe colors): Terrain Tiles on AWS Open Data; ETOPO1, NOAA; GMTED2010 and SRTM, USGS.
Follow the question
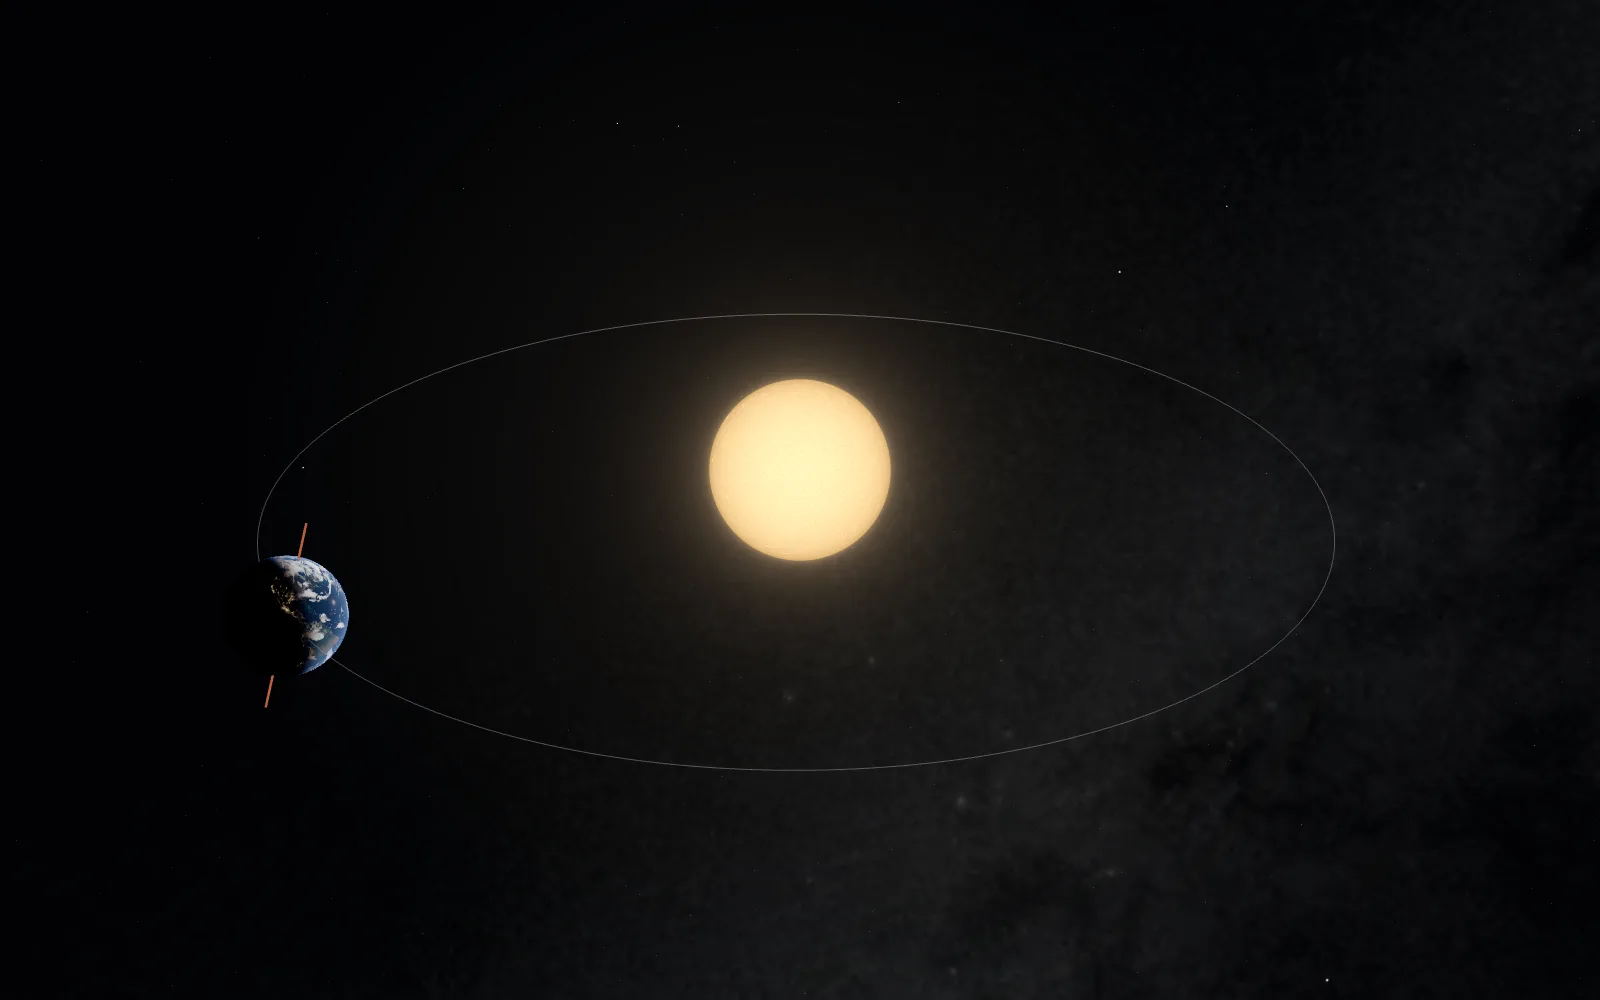 Plate 05Why Summer Is WarmNot because the Earth is closer to the Sun. In early January the Earth is at its closest — in the dead of the northern winter.
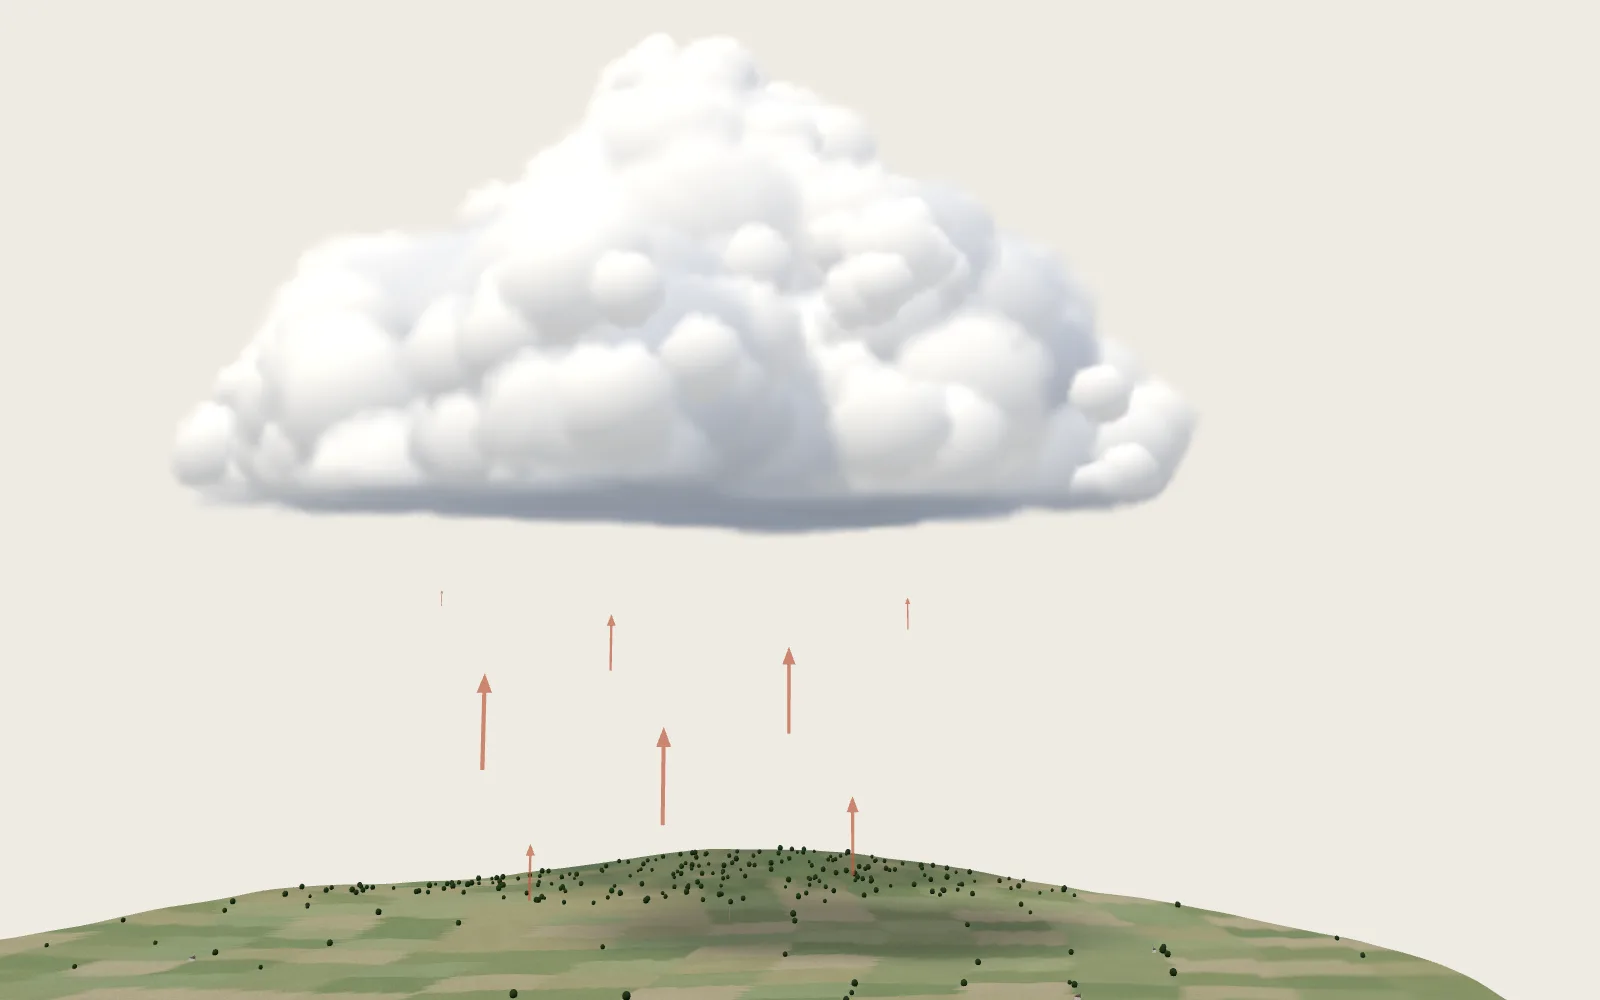 Plate 30Why Clouds Don’t FallAn ordinary cumulus cloud holds hundreds of tonnes of water, yet it floats. The secret is how astonishingly small its droplets are.