The Water Cycle
Sunlight lifts water off the sea, the lakes and the leaves as vapour. It rises, cools into cloud, falls as rain and snow, and runs back to the sea.
Scroll
Nearly All of It Is Sea
Earth holds about 1.38 billion km³ of water, and about 97 % of it is seawater. Glaciers and ice sheets hold about 1.9 %, groundwater about 1.6 %.
Lakes, soil, the air, rivers and living things together hold about two parts in ten thousand. The air holds only about 13,000 km³ at any moment: rained out at once, it would cover the globe about 2.5 cm deep. Rivers hold about 2,000 km³.
The numbers are the IPCC’s Sixth Assessment synthesis (the lakes are Abbott and colleagues’ 2019 estimate). The smaller a store, the faster its water is replaced.
Ocean about 1,335 million · ice about 26 million · groundwater about 22.6 million · air about 13,000 · rivers about 2,000 km³ (IPCC AR6)
The Sun Lifts It
Sunlight warms the sea, the lakes and damp ground, and some water molecules leave the surface carrying that energy, as invisible vapour. About 470,000 km³ a year evaporates from the sea, a layer about 1.3 m deep over the whole ocean (computed here), which rain and rivers put back.
The land gives off about 74,000 km³ a year. More than half of it is released by plants through their leaves, called transpiration; most estimates put it at about six tenths.
In 1687 Edmond Halley weighed a pan of water warmed to summer heat in London: in two hours it lost 233 grains. From that he reckoned that the nine great rivers flowing into the Mediterranean return in a day little more than a third of what it loses on a summer’s day.
Ocean evaporation about 470,000 · land about 74,000 km³ a year (IPCC AR6) · about 1.3 m of sea a year (computed)
Up, Cooler, Cloud
Warm, moist air rises, or is pushed up a mountainside, and cools as it goes. Cooler air holds less vapour, and the rest condenses on specks of dust and salt into tiny droplets and ice crystals: a cloud. A cloud is not vapour; vapour is invisible, and what we see are the droplets and crystals. Why they float is on the page “Why Clouds Don’t Fall”.
Most of the vapour from the sea falls back on the sea; only about a tenth is carried over land.
Water vapour stays in the air for about nine days on average (8.9 ± 0.4 days). With this page’s numbers, the air’s 13,000 km³ divided by about 544,000 km³ of rain and snow a year gives about 8.7 days.
About 13,000 km³ in the air · it stays about 9 days (van der Ent and Tuinenburg 2017; 8.7 computed) · about 10 % of the sea’s vapour reaches land
Rain and Snow
About 544,000 km³ of rain and snow falls each year, about 78 % of it on the sea (computed here). Of the 120,000 km³ that falls on land, about four tenths was evaporated from land in the first place.
Snow on high mountains is kept for months and melts in spring into lakes and rivers. Glaciers and ice sheets keep it far longer: water in the Antarctic ice sheet can stay thousands to hundreds of thousands of years.
The cloud on the model is schematic: it sits over the mountain, where the slope forces the air up, and its rain and snow fall on the peaks.
Precipitation about 544,000: about 424,000 on the sea, 120,000 on land, km³ a year (IPCC AR6) · about 78 % on the sea (computed)
Rivers Carry It Back
Each year about 46,000 km³ more falls on land than evaporates from it. That water runs back to the sea in rivers and through the ground, making up exactly what the sea loses to evaporation beyond its own rain.
Rivers hold only about 2,000 km³ at a time, yet about 46,000 km³ a year flows into the sea: their water is replaced about every 16 days (computed here).
In the 1670s Pierre Perrault reckoned three years of rain and snow on a catchment at the head of the Seine and found that the river needed only about a sixth of it to flow all year. A decade or so later Edme Mariotte measured the Seine at Paris and also found less than a sixth: rain and snow are enough to keep rivers flowing.
About 46,000 km³ a year to the sea (IPCC AR6) · about 2,000 km³ in rivers · replaced about every 16 days (computed)
Into the Ground
Part of the rain that reaches the ground soaks in. In the soil and the sand and gravel below it, the spaces hold both air and water: the unsaturated zone. Deeper down, every pore between the grains and every crack in the rock is full of water, and the top of that zone is the water table, the blue line on the cut.
Groundwater is not underground lakes and rivers; it is water filling the pores, like water in a sponge. Pores take about 25 % of the volume of sand and about 20 % of gravel.
About 13,000 km³ a year reaches the water table worldwide. The well on the cut is sunk below the water table, and the water inside it stands at the water table’s height.
Pores: sand about 25 %, gravel about 20 % (Heath 1983) · recharge about 13,000 km³ a year (IPCC AR6)
Groundwater Moves Slowly
Groundwater follows the slope of the water table, slowly, from high ground towards low, and seeps into rivers, lakes and the sea. In Heath’s examples it moves about 0.3 m a day through a coarse sand aquifer and about 0.00002 m a day through clay.
Paths near a river take days to a few years; long, deep paths take decades to millennia. Between rains, most of a river’s water is groundwater seeping in through its bed and banks, called base flow.
The upper 2 km of the continents hold about 22.6 million km³ of groundwater, of which less than 6 % is under 50 years old (the authors’ estimate). In many aquifers, four to more than eight tenths of the water was recharged before the Holocene.
Coarse sand about 0.3 m a day · clay about 0.00002 m a day (Heath 1983) · upper 2 km about 22.6 million km³ (Gleeson et al. 2016)
A Year’s Budget
All the year’s flows at once. The sea evaporates about 470,000 km³ and receives about 424,000 back as rain, leaving about 46,000 over; the land receives about 120,000 and evaporates about 74,000, also leaving about 46,000.
Those 46,000 km³ of vapour are blown from the sea to the land and flow back through rivers and the ground. Worldwide, evaporation and precipitation are both about 544,000 km³ a year: the budget balances.
Each band is as wide as its flow. The numbers are the IPCC’s Sixth Assessment synthesis, each uncertain by about 10 %.
Sea: 470 − 424 = 46 · land: 120 − 74 = 46 · rivers 46 (thousand km³ a year, IPCC AR6)
How Long It Stays
A store divided by the flow through it gives how long water stays there on average. With this page’s numbers: the air about 8.7 days, rivers about 16 days, the ocean about 2,800 years.
Young groundwater, about 630,000 km³ recharged by about 13,000 km³ a year, stays about 48 years; deeper, older groundwater can stay thousands of years or more. Lakes keep theirs about 50–100 years (a textbook estimate); ice sheets for thousands to hundreds of thousands of years.
Averages hide a lot: in warm, shallow coastal water, water evaporates quickly, yet the ocean as a whole takes two or three thousand years to turn over.
Air about 8.7 days · rivers about 16 days · young groundwater about 48 years · ocean about 2,800 years (computed)
Water Carries Heat
Evaporation takes in heat: at 20 °C, evaporating 1 kg of water takes about 2,450 kJ. The vapour carries that heat aloft and gives it up when it condenses into cloud, warming the air there. Evaporation cools the ground; condensation warms the air high up.
About 544,000 km³ of water evaporates each year, about 83 W for every square metre of Earth’s surface (computed here), close to the IPCC’s 82 W/m². NASA puts it as about a quarter of incoming sunlight leaving the surface by evaporation.
Evaporation and condensation over warm seas also fuel hurricanes (“The Engine of a Hurricane”); the ground’s whole energy budget is on “The Greenhouse Effect”.
About 2,450 kJ to evaporate 1 kg at 20 °C (NIST) · latent heat about 82 W/m² (IPCC AR6) · about 83 computed
A Warmer World
For every 1 °C of warming, air can hold about 7 % more water vapour. In satellite and reanalysis data for 1988–2014, the air’s water vapour rose by about 6.7 % for each degree of global warming.
Global precipitation and evaporation rise by only about 1–3 % a degree (the IPCC’s very likely range). Rain falls behind the vapour, so vapour stays longer in the air: in the high-emissions scenario SSP3-7.0, over land, from about 8 days now to about 9 by mid-century and about 10 late in the century.
Wet seasons and heavy downpours get wetter (IPCC, high confidence), but “wet gets wetter, dry gets drier” cannot simply be applied over land. Water vapour is also a greenhouse gas; it rises with temperature and amplifies warming (“The Greenhouse Effect”).
Water vapour about +7 % a degree (Clausius–Clapeyron) · global precipitation +1–3 % a degree (IPCC AR6, very likely)
The Block Taken Apart
The cloud and the snow come off first; the water of the lake, the river and the sea slides forward; the soil with its trees and the well lift away, showing the sand and gravel aquifer with its water table; below it, the clay bed, and at the bottom the granite.
Point at a part and it is lifted out on its own and named; left alone, the parts lift out one after another.
Cloud · snow · surface water · soil and plants · well · sand and gravel aquifer · clay bed · granite
Warm the Climate
Reading one is the water vapour in the air, at 7 % more per degree. Reading two is global precipitation at 2 % more per degree, the middle of the IPCC’s very likely 1–3 %, with 1 % and 3 % as its range. Reading three is how long vapour stays in the air: vapour ÷ precipitation.
Each change starts again from today’s climate; the bands for rain and evaporation widen and the rain thickens. This is a simple model of proportions, not a climate simulation.
Vapour × 1.07^ΔT · precipitation × 1.02^ΔT (1.01–1.03) · stay = vapour ÷ precipitation (computed)
Try thisWarm the climate from today to +3 °C: by how many per cent does the water vapour in the air grow, and global precipitation? How many more days does vapour stay in the air on average?
What the model leaves out
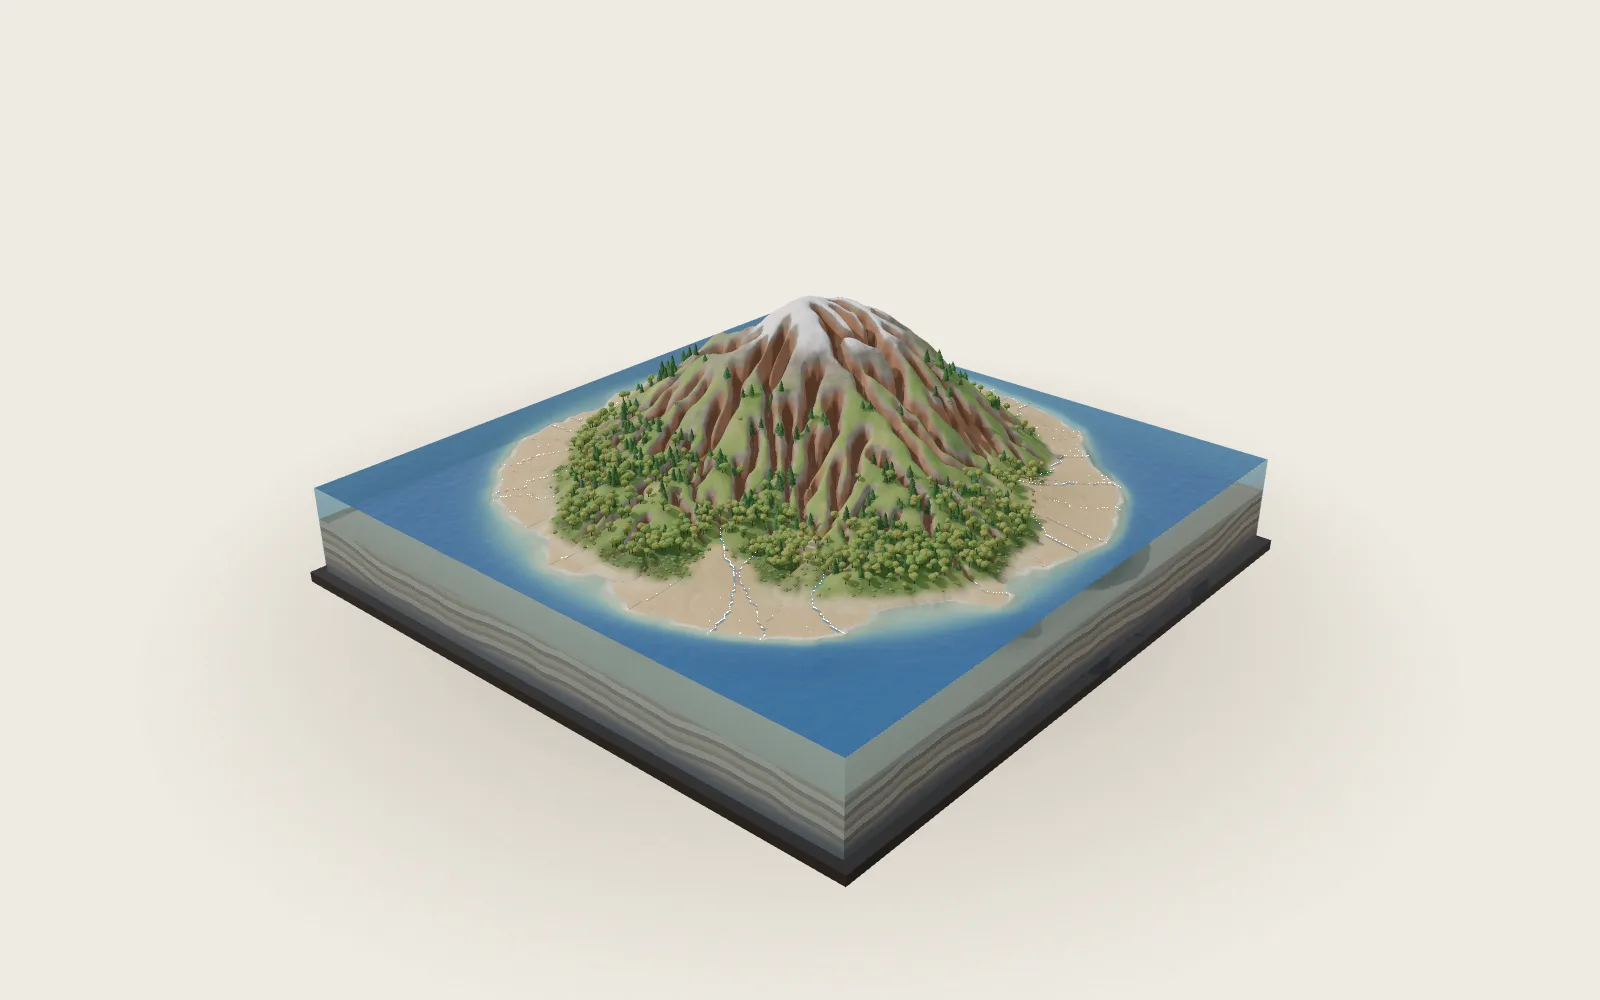
The block is this page’s own model, not a real place: mountains, a lake, a river and the sea crowded onto one piece of land, with the relief, the layers and the water exaggerated. The cut shows a single sand and gravel aquifer over clay and granite; real aquifers vary far more in thickness, layering and rock. The cloud and the blue arrows are a schematic layer, and the bands show global annual means; real flows vary hugely with place and season. Groundwater flowing straight into the sea is small and its estimates range from hundreds to thousands of km³ a year; it is not drawn on its own. Residence times are averages, a store over a flow, and the ocean’s uses evaporation only. The lab scales by fixed proportions; it leaves out changes in circulation, clouds and regions.
Easy to get wrong
Groundwater is not in underground lakes and rivers but in the pores between grains and the cracks in rock; caves and lava tubes are rare exceptions. A cloud is not vapour but condensed droplets and ice crystals. The cycle has no starting point: about four tenths of the rain on land was evaporated from land. “The water you drink was drunk by dinosaurs” holds only in this sense: Earth’s water keeps cycling, but molecules are split in photosynthesis and made again in decay, so there is no “same drop”. A degree of warming adds about 7 % to the vapour but only 1–3 % to precipitation. Vapour stays in the air about nine days on average; “4–5 days” is the median, not the mean. “Ice holds about 69 % of fresh water” counts deep, low-salinity groundwater as fresh; counting only young groundwater, as the IPCC does, ice holds about 96 %. The two cannot be compared with each other.
Common questions · 5
- Where is most of Earth’s water?
Earth holds about 1.38 billion km³ of water, and about 97 % of it is seawater.
01Nearly All of It Is Sea ↑- How long does water vapour stay in the air?
Water vapour stays in the air for about nine days on average (8.9 ± 0.4 days).
03Up, Cooler, Cloud ↑- Is groundwater an underground lake or river?
Groundwater is not underground lakes and rivers; it is water filling the pores, like water in a sponge.
06Into the Ground ↑- Does the water cycle’s yearly budget balance?
Those 46,000 km³ of vapour are blown from the sea to the land and flow back through rivers and the ground.
08A Year’s Budget ↑- How much more rain falls in a warmer world?
Global precipitation and evaporation rise by only about 1–3 % a degree (the IPCC’s very likely range).
11A Warmer World ↑
Sources
- IPCC (2021): AR6 Working Group I, chapter 8 (Douville et al.), Figure 8.1 stores and fluxes; about 7 % more water vapour a degree; 1–3 % more precipitation; the vapour’s residence time
- IPCC (2021): AR6 Working Group I, chapter 7, Figure 7.2 (latent heat about 82 W/m²)
- B. W. Abbott et al. (2019): Human domination of the global water cycle absent from depictions and perceptions, Nature Geoscience 12, 533 (lakes)
- USGS Water Science School: Where is Earth’s Water?
- USGS Water Science School: The Atmosphere and the Water Cycle (all the air’s water would cover the globe about 2.5 cm deep)
- USGS Water Science School: Evaporation and the Water Cycle (about 10 % of the ocean’s evaporation falls on land)
- USGS Water Science School: Groundwater Flow and the Water Cycle (underground rivers “pretty much a myth”; water in a sponge)
- USGS Water Science School: What is groundwater? (the unsaturated and saturated zones, pores and fractures)
- USGS Water Science School: Rivers Contain Groundwater (base flow)
- USGS Water Science School: Snowmelt Runoff and the Water Cycle
- R. C. Heath (1983): Basic Ground-Water Hydrology, USGS Water-Supply Paper 2220 (porosity, velocity examples)
- T. C. Winter et al. (1998): Ground Water and Surface Water: A Single Resource, USGS Circular 1139 (flow paths of days to millennia)
- T. Gleeson et al. (2016): The global volume and distribution of modern groundwater, Nature Geoscience 9, 161
- S. Jasechko et al. (2017): Global aquifers dominated by fossil groundwaters but wells vulnerable to modern contamination, Nature Geoscience 10, 425
- Z. Wei et al. (2017): Revisiting the contribution of transpiration to global terrestrial evapotranspiration, GRL 44, 2792
- R. J. van der Ent and O. A. Tuinenburg (2017): The residence time of water in the atmosphere revisited, HESS 21, 779 (8.9 ± 0.4 days)
- R. J. van der Ent et al. (2010): Origin and fate of atmospheric moisture over continents, Water Resources Research 46 (about 40 % of land precipitation from land evaporation)
- I. M. Held and B. J. Soden (2006): Robust responses of the hydrological cycle to global warming, J. Climate 19, 5686
- NIST Chemistry WebBook: saturation properties of water (IAPWS-95; latent heat)
- NASA Earth Observatory: Climate and Earth’s Energy Budget (about 25 % of incoming sunlight leaves the surface by evaporation)
- NASA: Earth Fact Sheet (mean radius 6,371 km)
- NOAA JetStream: Clouds (clouds are droplets and ice crystals)
- UCAR Center for Science Education: The Water Cycle (over 3,000 years in the ocean; thousands to hundreds of thousands of years in ice sheets)
- M. Pidwirny (2006): The Hydrologic Cycle, Fundamentals of Physical Geography (lakes 50–100 years, seasonal snow 2–6 months)
- E. Halley (1687): An Estimate of the Quantity of Vapour Raised out of the Sea by the Warmth of the Sun, Phil. Trans. 16, 366
- E. Mariotte (1686): Traité du mouvement des eaux (1700 edition, part I, pp. 31–33, the Seine)
- J. J. McDonnell et al. (2025): The first catchment water balance: new insights into Pierre Perrault…, Hydrol. Sci. J. 70, 27
- S. Barontini and M. Settura (2020): Beyond Perrault’s experiments, HESS 24, 1907 (“about one-sixth”)
Data
Water stores and yearly flows: IPCC AR6 WGI, chapter 8, Figure 8.1 (Douville et al. 2021), each flow ±10 %; lakes from Abbott et al. (Nature Geoscience 12, 533, 2019). The residence times, the shares, the layer of sea evaporated in a year, the latent heat flux and the lab’s warmer climate (water vapour +7 % a degree, precipitation +1–3 % a degree, both from AR6) are computed on this page. Latent heat: NIST Chemistry WebBook (IAPWS-95). The block of country, its layers, its water table and its well are this page’s own model, not a real place; the relief, the layers and the water are exaggerated. The cloud and the blue arrows are a schematic layer. Material presets and the softbox studio of the site’s model kit are ported from AirsupHQ/machine-skill (MIT, © 2026 Air Supply Technologies Inc.).
The text, pictures and models on this page are licensed CC BY-NC 4.0: free to use and adapt for teaching and other non-commercial purposes, with credit to world.lapla.si. Third-party material listed above keeps its own licence.
Cite this plate
Laplace’s Mini World, Plate 77, “The Water Cycle”, https://world.lapla.si/en/watercycle/, CC BY-NC 4.0, updated 2026-11-02.
Follow the question
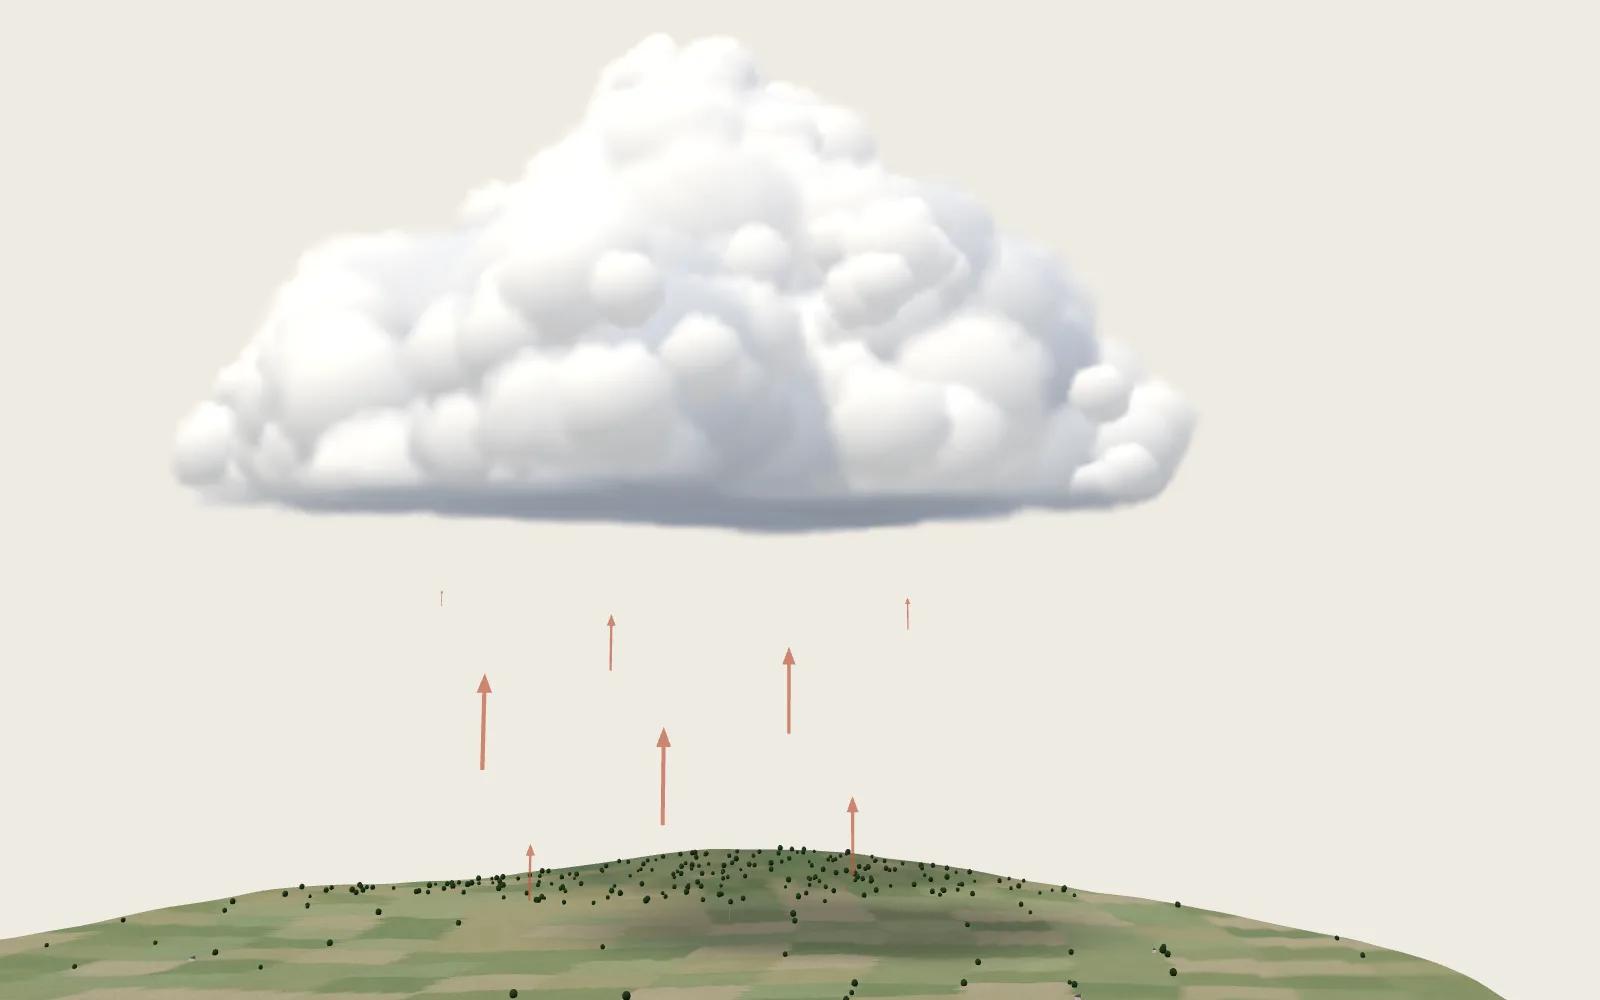 Plate 30Why Clouds Don’t FallAn ordinary cumulus cloud holds hundreds of tonnes of water, yet it floats. The secret is how astonishingly small its droplets are.
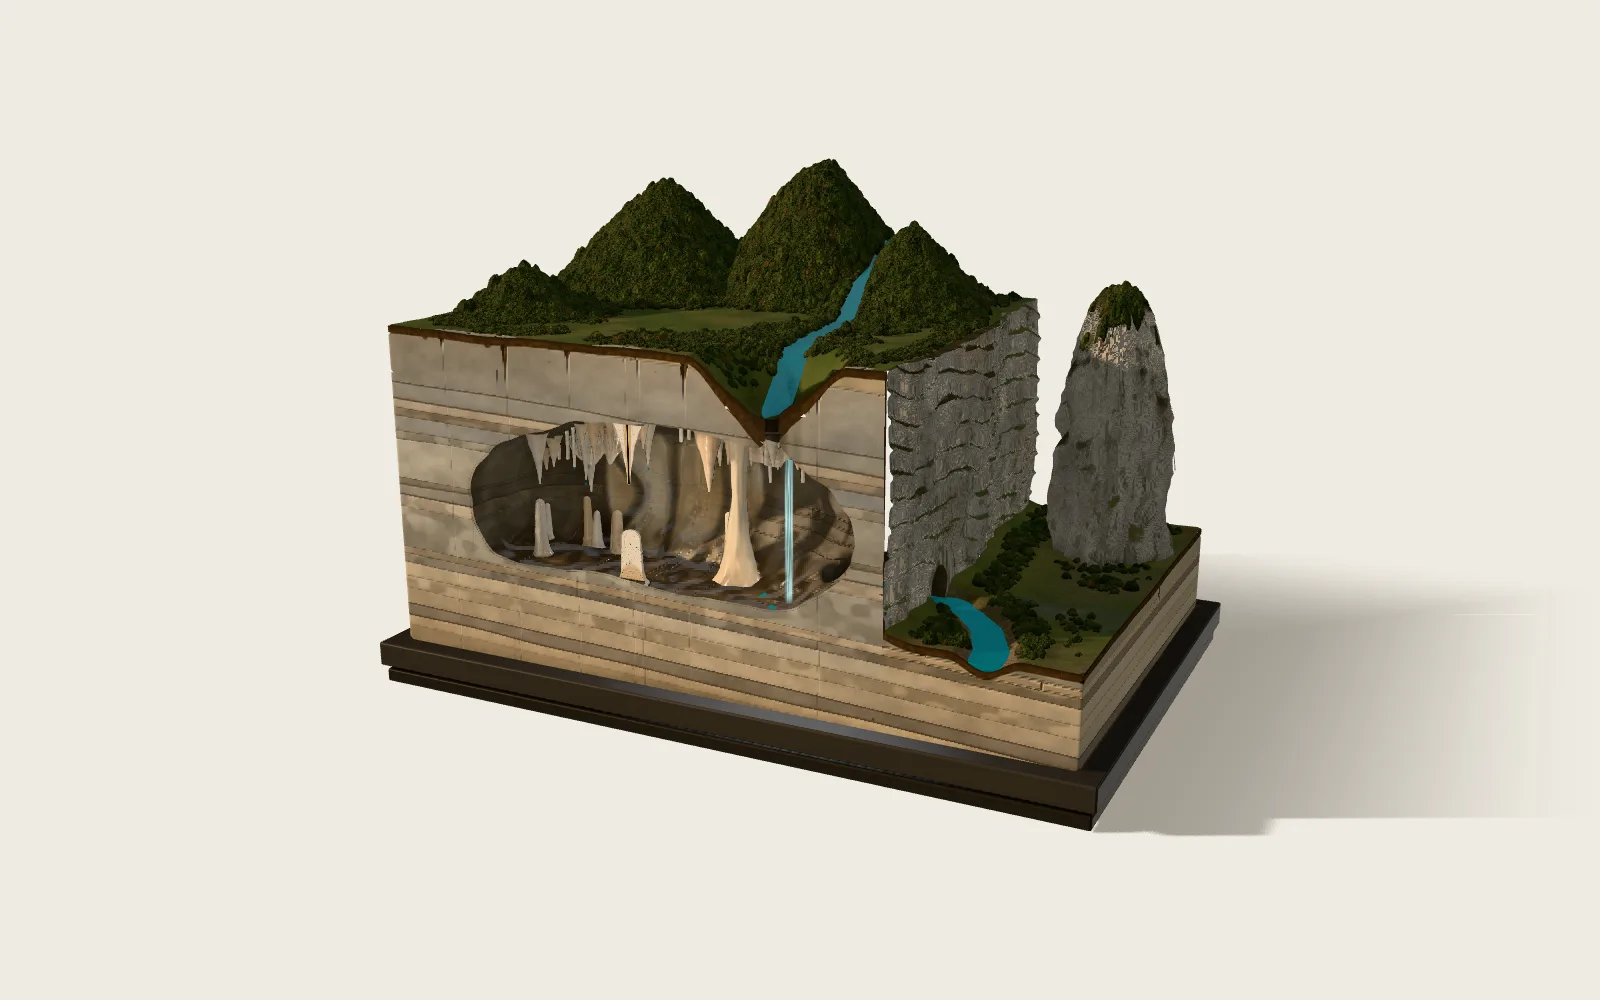 Plate 60Caves and DripstoneRain soaks through soil, picks up carbon dioxide and turns into a weak acid; it eats into limestone along its cracks and opens dolines, caves and underground rivers. Where it drips into a cave it gives the gas to the cave air, and the dissolved calcium carbonate comes back out, layer by layer, as stalactites and stalagmites. The model is a block of karst country cut open: bedded limestone, a cave, an underground river and a spring.